CITE THIS NOTEBOOK: Predictive validity in drug discovery: what it is and how to improve it by Jack Scannell. Wolfram Community NOV 14 2022.
ORIGINAL ARTICLE: Scannell, J.W., Bosley, J., Hickman, J.A. et al. Predictive validity in drug discovery: what it is, why it matters and how to improve it. NATURE Reviews Drug Discovery (2022). https://doi.org/10.1038/s41573-022-00552-x
ORIGINAL ARTICLE: Scannell, J.W., Bosley, J., Hickman, J.A. et al. Predictive validity in drug discovery: what it is, why it matters and how to improve it. NATURE Reviews Drug Discovery (2022). https://doi.org/10.1038/s41573-022-00552-x
Article abstract: Successful drug discovery is like finding oases of safety and efficacy in chemical and biological deserts. Screens in disease models, and other decision tools used in drug research and development (R&D), point towards oases when they score therapeutic candidates in a way that correlates with clinical utility in humans. Otherwise, they probably lead in the wrong direction. This line of thought can be quantified by using decision theory, in which ‘predictive validity’ is the correlation coefficient between the output of a decision tool and clinical utility across therapeutic candidates. Analyses based on this approach reveal that the detectability of good candidates is extremely sensitive to predictive validity, because the deserts are big and oases small. Both history and decision theory suggest that predictive validity is under-managed in drug R&D, not least because it is so hard to measure before projects succeed or fail later in the process. This article explains the influence of predictive validity on R&D productivity and discusses methods to evaluate and improve it, with the aim of supporting the application of more effective decision tools and catalysing investment in their creation.
Introduction
Introduction
This paper is the third in a series of papers on R&D productivity in the pharmaceutical industry. The first, from 2012, drew a contrast between a long term decline in important measures of R&D productivity from 1950 to 2010; a decline that took place in the face of huge gains in the efficiency and quality of many of the technologies that are believed to be important for biomedical science. It coined the term “Eroom’s Law” to contrast the exponential decline in biopharmaceutical R&D efficiency with “Moore’s Law” for the exponential increase in certain measures of computing efficiency. “Eroom” is “Moore” spelled backwards.
The second paper, from 2016, applied decision theory to drug R&D, treating it as a formal search process, and exploring the parameters to which search efficiency was sensitive. The general result was that “quality beats quantity”. Gains in brute force efficiency in R&D have relatively little effect on overall efficiency, which is much more sensitive to the “predictive validity” of the model systems in which drugs are tested (e.g., in vitro models, animal models, etc.). It argued that R&D productivity has declined, in part at least, because good models identify good drugs, which render the good models commercially redundant. This leaves the drug industry working, over time, on diseases that lack good models, which progressively drags on R&D productivity. The 2016 paper has a detailed Mathematic appendix which sets out the decision theoretic analysis in more detail than the most recent paper.
Paper 1: Diagnosing the decline in pharmaceutical R&D efficiency (2012). https://www.nature.com/articles/nrd3681
Paper 2: When Quality Beats Quantity: Decision Theory, Drug Discovery, and the Reproducibility Crisis. https://journals.plos.org/plosone/article?id=10.1371/journal.pone.0147215
This third paper aimed to put the decision theoretic results in a practical context for people invoved in academic and commercial drug discovery.
Predictive validity, throughput and research and development decision performance (Figure 2)
Predictive validity, throughput and research and development decision performance (Figure 2)
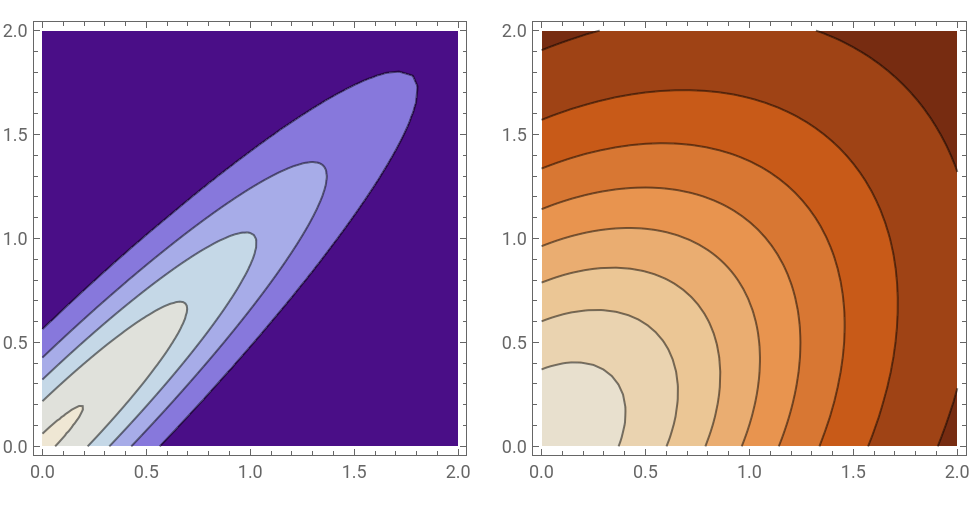
Figure 2 of the paper provides a simple explanation of the decision theoretic treatment. See here for annotated figure: https://rdcu.be/cWTtO
Note that Figure 2 is something of a cartoon which designed to show the general principles of the analysis. To make the contour shading easily visible and comparable with the line graphs, we have adjusted some of the axis scaling in the published version.
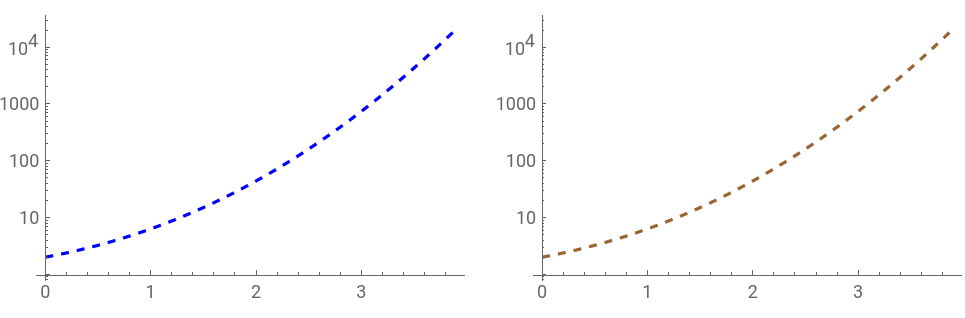
The left panel and right panels below show the number of therapeutic candidates that one would have to test (vertical axes, log10 scales) to expect to find one that exceeds the selection threshold (horizontal axis). Refer to the paper for figure annotation.
μ=0;(*themeanvalueforY,thevariablefromtheDecisionTool,andR,thevariablethatdescribesclinicalutility*)σ=1;(*thestandarddeviationforscoresonthedecisiontoolandclinicalutility*)=3.0902;(*Clinicalutilitythreshold.0.1%oftheprobabilitymassofcandidatesliesabovethisvalue*)outputhh=Table[0,{40},{3}];(*tabletocontainresultsforthehighPredictiveValiditycase*)outputhl=Table[0,{40},{3}];(*tabletocontainresultsforthelowPredictiveValiditycase*)
r
t
create points for graph of the high Predictive Validity case
hρYR=0.95;(*Setthehighcorrelationcoefficientbetweendecisiontoolscoreandclinicalutility*)For[i=1,i<41,i++,=(i-1)/10;(*Settheselectionthresholdparameteronthedecisiontool,whichisinunitsofstandarddeviation*)throughput=1/NIntegrate[PDF[MultinormalDistribution[{μ,μ},{{σ,hρYR},{hρYR,σ}}],{y,r}],{y,,10},{r,-10,10}];ppv=NIntegrate[PDF[MultinormalDistribution[{μ,μ},{{σ,hρYR},{hρYR,σ}}],{y,r}],{y,,10},{r,,10}]/NIntegrate[PDF[MultinormalDistribution[{μ,μ},{{σ,hρYR},{hρYR,σ}}],{y,r}],{y,,10},{r,-10,10}];outputhh[[i]]={,throughput,ppv};]
y
t
y
t
y
t
r
t
y
t
y
t
create points for graphs with low Predictive Validity
lρYR=0.4;(*Setthelowcorrelationcoefficientbetweendecisiontoolscoreandclinicalutility*)For[i=1,i<41,i++,=(i-1)/10;(*Setthereferencethresholdparameter,whichisinunitsofstandarddeviation*)throughput=1/NIntegrate[PDF[MultinormalDistribution[{μ,μ},{{σ,lρYR},{lρYR,σ}}],{y,r}],{y,,10},{r,-10,10}];ppv=NIntegrate[PDF[MultinormalDistribution[{μ,μ},{{σ,lρYR},{lρYR,σ}}],{y,r}],{y,,10},{r,,10}]/NIntegrate[PDF[MultinormalDistribution[{μ,μ},{{σ,lρYR},{lρYR,σ}}],{y,r}],{y,,10},{r,-10,10}];outputhl[[i]]={,throughput,ppv};]
y
t
y
t
y
t
r
t
y
t
y
t
Note that Figure 2 is something of a cartoon which designed to show the general principles of the analysis. To make the contour shading easily visible and comparable with the line graphs, we adjusted the axis scaling for the version in the paper
g1a=ContourPlot[PDF[MultinormalDistribution[{0,0},{{1,0.95},{0.95,1}}],{x,y}],{x,0,2},{y,0,2},PlotRange->All,ColorFunction->"LakeColors"];g2a=ContourPlot[PDF[MultinormalDistribution[{0,0},{{1,0.4},{0.4,1}}],{x,y}],{x,0,2},{y,0,2},PlotRange->All,ColorFunction->"SiennaTones"];thresholdplot1=ListPlot[Transpose[{outputhh[[All,1]],outputhh[[All,3]]}],Joined->True,PlotStyle->{Blue,Thick},PlotRange->{{0,4},{0,1}}];thresholdplot2=ListPlot[Transpose[{outputhl[[All,1]],outputhl[[All,3]]}],Joined->True,PlotStyle->{Brown,Thick},PlotRange->{{0,4},{0,1}}];throughputplot1=ListLogPlot[outputhh[[All,1;;2]],Joined->True,PlotStyle->{Blue,Dashed}];throughputplot2=ListLogPlot[outputhl[[All,1;;2]],Joined->True,PlotStyle->{Brown,Dashed}];CompositeFig=GraphicsGrid[{{g1a,g2a}},ImageSize->Medium]CompositeFig=GraphicsGrid[{{thresholdplot1,thresholdplot2}},ImageSize->Medium]CompositeFig=GraphicsGrid[{{throughputplot1,throughputplot2}},ImageSize->Medium]
The left panel and right panels below show the number of therapeutic candidates that one would have to test (vertical axes, log10 scales) to expect to find one that exceeds the selection threshold (horizontal axis). Refer to the paper for figure annotation.
The left panel and right panels below show the number of therapeutic candidates that one would have to test (vertical axes, log10 scales) to expect to find one that exceeds the selection threshold (horizontal axis). Refer to the paper for figure annotation.
The left panel and right panels below show the number of therapeutic candidates that one would have to test (vertical axes, log10 scales) to expect to find one that exceeds the selection threshold (horizontal axis). Refer to the paper for figure annotation.
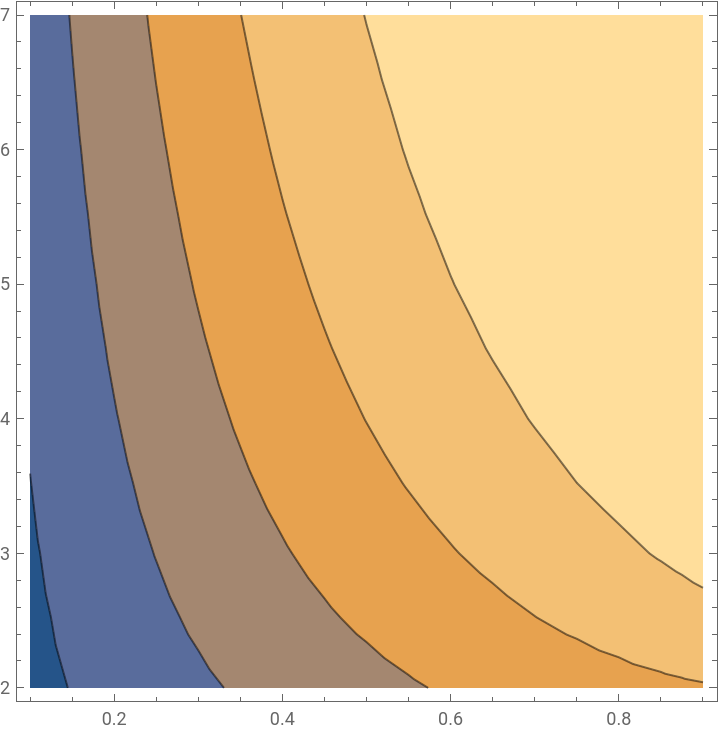
R&D productivity is very sensitive to predictive validity (Figures 3A and 3B)
R&D productivity is very sensitive to predictive validity (Figures 3A and 3B)
Figure 3A shows how the positive predictive value of a step in the R&D process varies with the number of candidates that can be screened (vertical axis, log10 scale). See here for annotated figure: https://rdcu.be/cWTtO
for more details of the mathematical treatment see Scannell & Bosley, 2016: https://journals.plos.org/plosone/article?id=10.1371/journal.pone.0147215 including the supplementary
materials
materials
ppvtableoutput=Table[0,{18*11},{3}];(*tabletostoretheresultsofthesimulations*)rYR={0.9,0.875,0.85,0.8,0.75,0.7,0.65,0.6,0.55,0.5,0.45,0.4,0.35,0.3,0.25,0.2,0.15,0.1};(*anarrayofcorrelationcoefficientsforthePredictiveValidityparameteronthehorizontalaxisoftheplot*)={0.01,0.003,0.001,0.0003,0.0001,0.00003,0.00001,0.000003,0.000001,0.0000003,0.0000001};(*anarrayofdecisionthresholdsexpressedintermsofquantileswithinthedistribution,so0.1isthetop10%ofvalues,0.01isthetop1%ofvalues,etc.Thisisfortheverticalaxisoftheplot*)(*turnthearraysofquantile-basedthresholdsintostandard-deviationbasedlocationswithinanormalPDFsowecanintegratethePDFtofindtheprobabilitymasses*)yquantiles=;For[i=1,i<12,i++,yquantiles[[i]]=Quantile[NormalDistribution[0,1],(1-[[i]])];]=yquantiles[[3]];(*setthereferencethreshold;thescoreonthereferencevariable,namelyclinicalutility,thatisrequiredforsuccess.Inthisexample,theprobabilitythatarandomlyselectedcandidatewillhaveenoughutiltytoworkinhumansis0.0001.Thegeneralpatternofresultsisfairlyinsensitivetothisparameteraslongasgoodcandidatesarerare;lessthan10%oftheprobabilitymass*)(*TheloopbelowgeneratesthePPVvaluesforthefigure.Itgeneratesadatatablebycyclingthroughthecorrelationanddecisionthresholdparameters*)count=1;For[j=1,j<12,j++,(*iteratethroughallthedecisionthresholds*)For[k=1,k<19,k++,(*iteratethroughallthecorrelationparameters*)truepositive=NIntegrate[PDF[BinormalDistribution[rYR[[k]]],{y,r}],{y,yquantiles[[j]],10},{r,,10}];(*Numericalintegration,buttherangeiswideversusthestandarddeviationofthedistribution*)falsepositive=NIntegrate[PDF[BinormalDistribution[rYR[[k]]],{y,r}],{y,yquantiles[[j]],10},{r,-10,}];(*Numericalintegration,buttherangeiswideversusthestandarddeviationofthedistribution*)ppv=truepositive/(truepositive+falsepositive);(*calculatethepositivepredictivevalue*)ppvtableoutput[[count]]={rYR[[k]],-Log[10,[[j]]],Log[10,ppv]};count=count+1;]]fig3A=ListContourPlot[ppvtableoutput](*plottoshowhowpositivepredictivevaluevarieswiththresholdorthroughputontheverticalaxis,andPredictiveValidityonthehorizontalaxis.SeethesupplementaryExcelfileforthefinancialmodelthatconvertsPPVbelowintofinancialvalueestimates*)
y
t
y
t
y
t
r
t
r
t
r
t
y
t