Lorenz Curves and the Gini Coefficient
Lorenz Curves and the Gini Coefficient


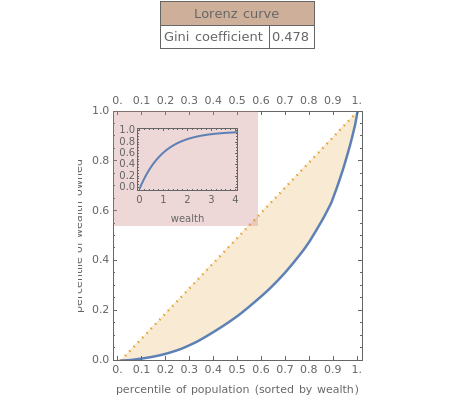
The Lorenz curve is a measure of the distribution of wealth (or income or other factors) in a society. The value of the curve corresponds to a percentile of the population ordered according to the characteristic in question. The value of the curve represents that portion of the total value of the characteristic in question held by people no wealthier than the -valued percentile of the population. Thus, the value (0.7, 0.3) means that the bottom 70% of the population owns 30% of the total wealth in society. The Gini coefficient is the (shaded) area between the Lorenz curve that would exist in a perfectly egalitarian society (the dashed line) and the Lorenz curve that does exist, divided by the area under the Lorenz curve that would exist in a perfectly egalitarian society. The coefficients are thus normalized to run from zero in a perfectly egalitarian society, to one in a society in which the wealthiest person held all the wealth. By way of reference, the United States has a Gini coefficient of 0.4; Sweden has a Gini coefficient of 0.25; Bolivia has a Gini coefficient of 0.61. This Demonstration allows you to select a random distribution from which to draw the wealths of the members of a size-selectable population. It computes the corresponding Lorenz curve and Gini coefficient and insets the corresponding cumulative distribution of wealth.
x
y
x
Details
Details
This Demonstration uses a numeric method (sampling) to compute the Gini coefficient for a given distribution. Analytic computation of this coefficient from a given distribution of wealth is often difficult.
External Links
External Links
Permanent Citation
Permanent Citation
Seth J. Chandler
"Lorenz Curves and the Gini Coefficient"
http://demonstrations.wolfram.com/LorenzCurvesAndTheGiniCoefficient/
Wolfram Demonstrations Project
Published: April 29, 2007