We explore the dynamics of the agent based SIR model and calculate the formula for the analog of reproduction number.
The SIR differential equation model
The SIR differential equation model
The classical susceptible, infectious and recovered (SIR) epidemiological model undergoes a phase transition when the reproduction number =1.
This will occur when the speed of infection is greater than zero.
R
0
This will occur when the speed of infection is greater than zero.
i'[t](βs[t]/N-1/μ)i[t]
where β is the contact rate, s[t] is the number of susceptibles, N is the total population and μ is the infectious period. Assuming that i[t] 0 then s[t] /N 1, we obtain
β-1/μ>=0βμ≥1=βμ≥1
R
0
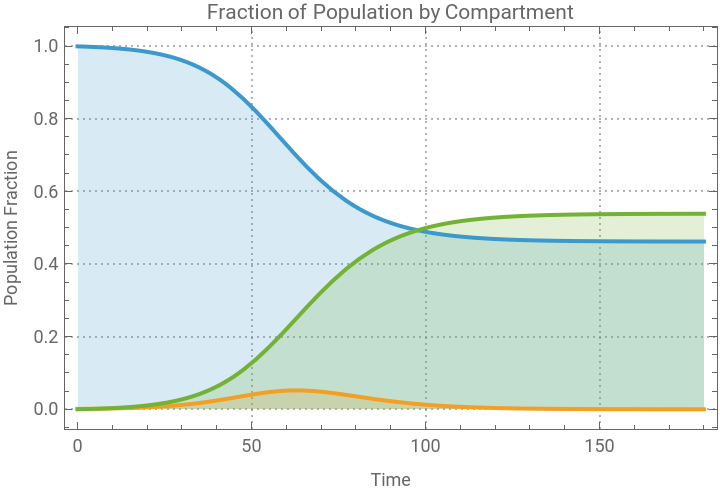
Visualizing the transition between a population free from infection and an epidemic. Making μ = 1 then β.
R
0
In[]:=
With{μ=5},sirSoln=ParametricNDSolve[{sd'[t]-βsd[t]id[t]/population,id'[t]==βsd[t]id[t]/population-id[t]/μ,rd'[t]==id[t]/μ,id[0]1,rd[0]0.,sd[0]population-1},{sd,id,rd},{t,0,maxTime},β];ManipulatePlotEvaluate[({sd[/μ][t],id[/μ][t],rd[/μ][t]}/population)/.sirSoln],,{{,.99},0.9,2},SaveDefinitions->True
R
0
R
0
R
0
R
0
Out[]=




An agent based model approach to epidemiology
An agent based model approach to epidemiology
The agent based model approach allows the inclusion of different properties and interactions in the epidemiologic model, as each host is represented uniquely an can be assigned specific characteristics (such as its unique contact network, mobility, infection duration, etc.). In this essay, our agent based model is set up as follows:
◼
Each agent belongs to a contact network, represented by a Watts Strogratz Random Graph of 1,000 nodes, a rewiring probability of 0.04 and a regular degree that spans in the experiments from 2 to 10.
◼
In each time tick, a susceptible agent might be infected by a compromised neighbor with probability "ContactRate". The range explores goes from x to y.
◼
The infectious period is distributed according to a log normal distribution of time spanning from x to y with a dispersion of 1.35.
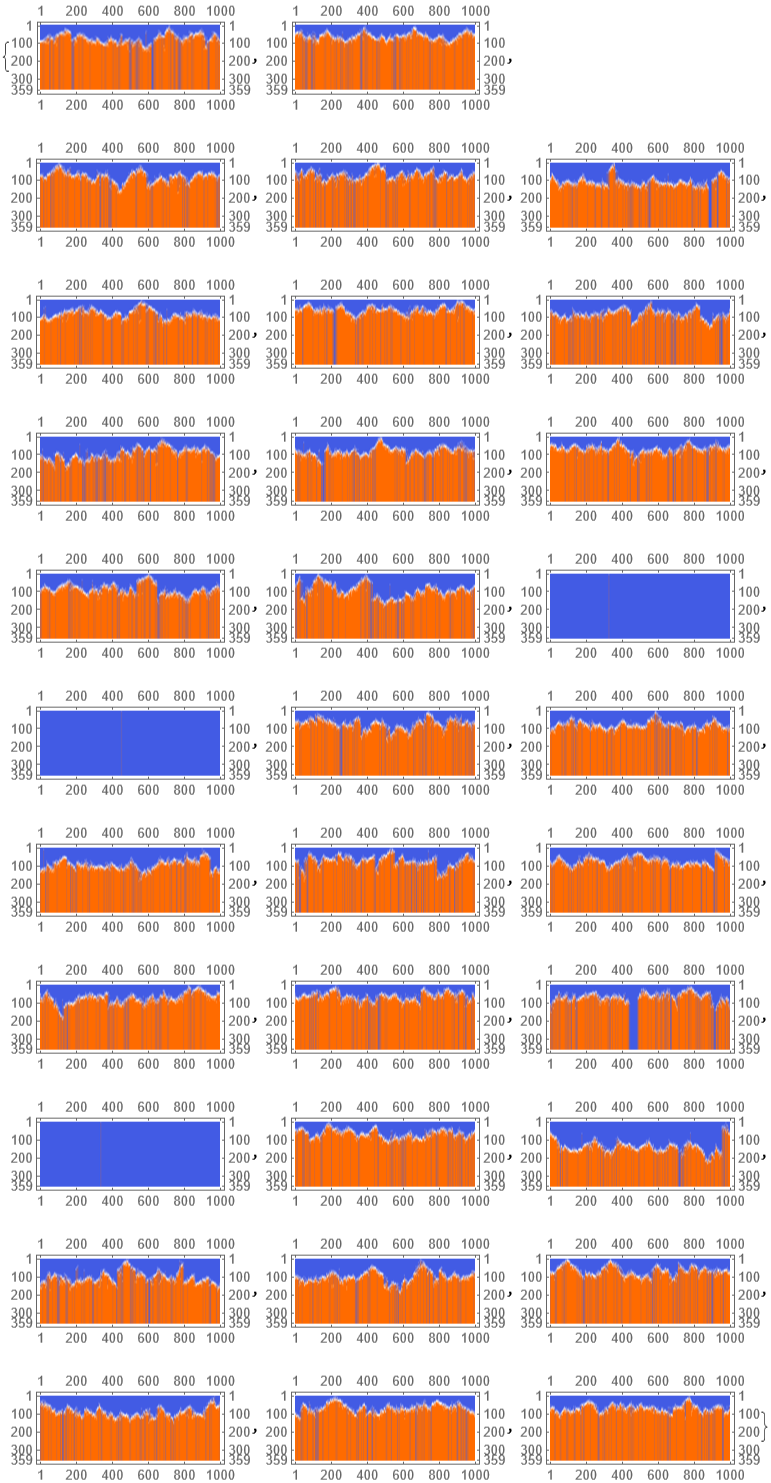
Run a set of 32 simulations on a network of regular degree 12, contact rate 0.012 and infectious period 12
In[]:=
gr=RandomGraph[WattsStrogatzGraphDistribution[1000,0.04,9]];val=ParallelTable[simGraph[gr,360,<|β[IP]0.012,aip12|>],{nbrSims,32}];
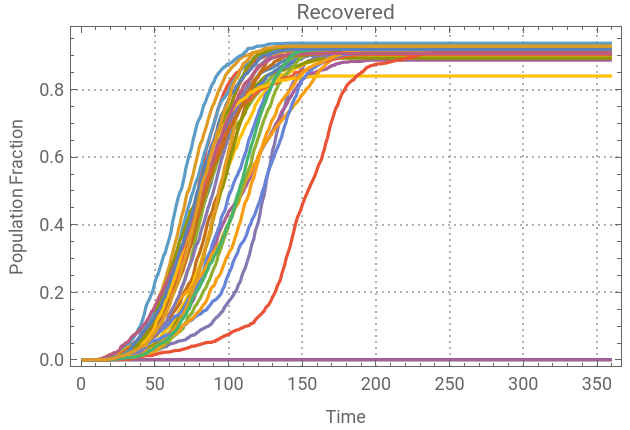
It is interesting to visualize that in several scenarios the spread of the disease did not prosper, while in other scenarios, the pathogen distributed across the whole population.
In[]:=
MatrixPlot/@val
Out[]=
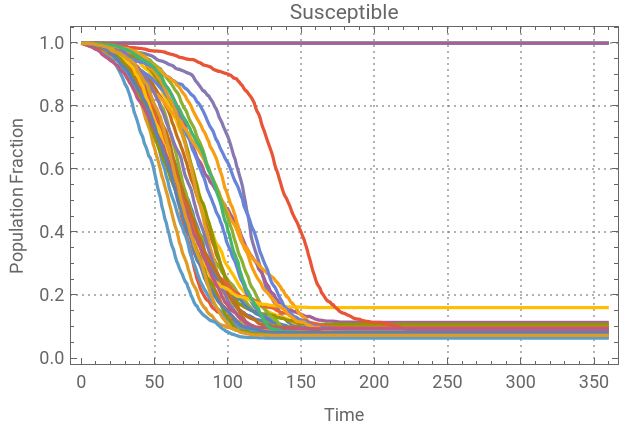
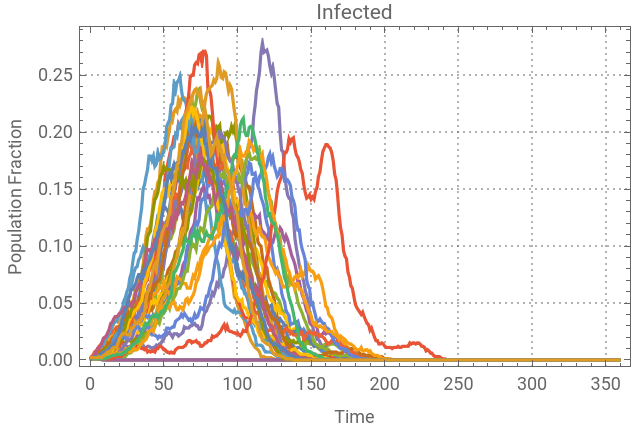
Visualizing the trend of each compartment across all simulations.
In[]:=
With{td=createTemporalData[val]/1000.},ListPlottd[#],&/@Keys[td]
Out[]=
,
,
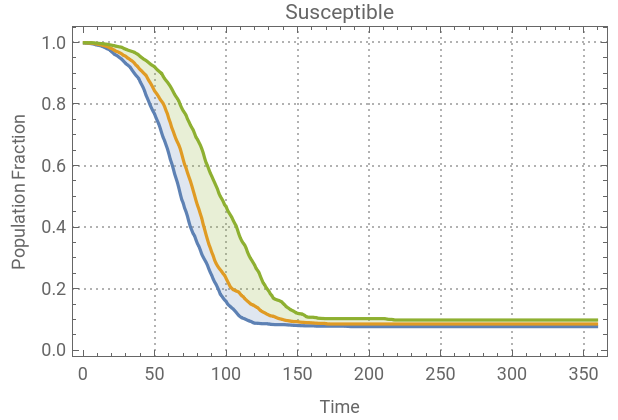
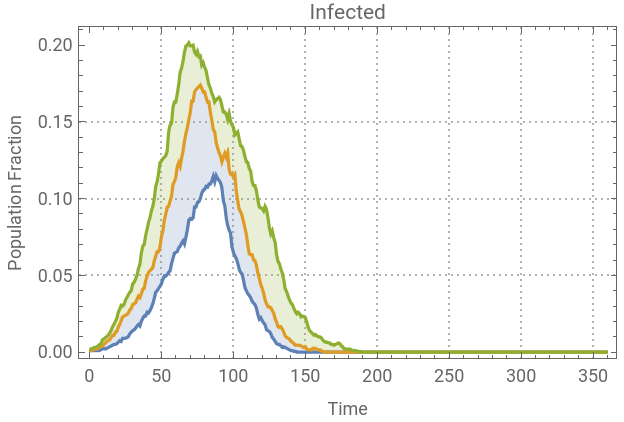
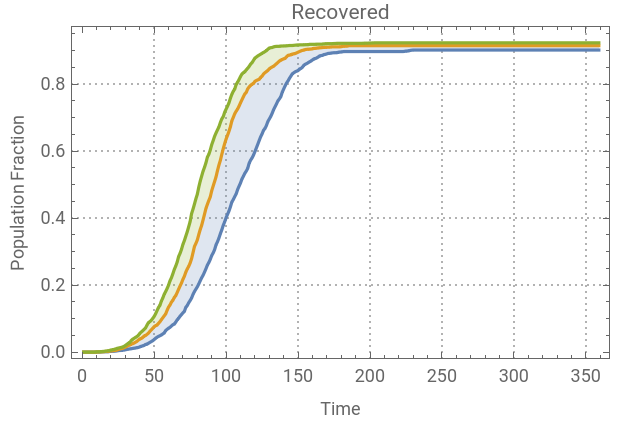
Data can be aggregated to show the 25%, 50% and 75% quartile.
In[]:=
With{td=createAQuartiles[createTemporalData[val]/1000.]},ListPlottd[#],&/@Keys[td]
Out[]=
,
,
Exploring the parameter space
Exploring the parameter space
The following code was used to generate a whole simulation set across different parameter values.
With the parameters established, the simulations can be performed.
The generated simulation results were saved for future analysis.
Analysis
Analysis
When the epidemiological model enters a transition phase, the number of susceptible at the end of the simulation can vary significantly between the different runs. We have saved the variance of the number of susceptible.
We can visualize the transition with the use of contour plots
By identifying the maximum variance for each set of parameters:
Examples
Examples
Find the regular degree in the transition for β=0.05 and infectious period = 3.
Similar test for β=0.12 and infectious period = 4.5.
Conclusion
Conclusion
For the particular network configuration explored, and the infectious period distribution specified, we were able to obtain a formula estimate for the reproduction number for the agent based model. Values above one for this metric indicate that the pathogen simulated will spread through the network used as the contact network.
Initialization Cells
Initialization Cells
CITE THIS NOTEBOOK
CITE THIS NOTEBOOK
Phase transition of a SIR agent-based models
by Diego Zviovich
Wolfram Community, STAFF PICKS, 2022
https://community.wolfram.com/groups/-/m/t/1977230
by Diego Zviovich
Wolfram Community, STAFF PICKS, 2022
https://community.wolfram.com/groups/-/m/t/1977230