A single column of Antarctic ice holds a continuous 800,000-year diary of Earth’s atmosphere. Bubbles trapped in the ice preserve ancient air; the ice itself records temperature through its hydrogen isotopes. From two published EPICA Dome C records we reconstruct the eight glacial–interglacial cycles, expose their ~100,000-year Milankovitch rhythm with a power spectrum, rebuild the orbital pacemakers from first principles, ask which moves first (CO₂ or temperature), and follow the rhythm back five million years through the Mid-Pleistocene Transition. Today’s 427 ppm of CO₂ sits about 128 ppm above anything in the 800,000-year record — reached in a century and a half, not ten thousand years — and was last matched some 3 million years ago.
1. The frozen archive
1. The frozen archive
Snow that falls on the East Antarctic plateau rarely melts. It compresses, layer on layer, into ice up to three kilometres thick. The European Project for Ice Coring in Antarctica (EPICA) drilled a core at Dome C (75°S, 123°E) that reaches back ~800,000 years — eight complete ice-age cycles. Two quantities are read from it:
◼
Atmospheric CO₂ from air bubbles sealed in the ice. As snow turns to ice, it traps a sample of the contemporary atmosphere. We use the 800 kyr Antarctic composite of Bereiter et al. (2015).
◼
Temperature from the deuterium (heavy hydrogen, δD) content of the ice. Colder air delivers isotopically lighter snow, so δD is a thermometer. We use the reconstruction of Jouzel et al. (2007) on the EDC3 age scale.
⚠
2. Eight glacial–interglacial cycles
2. Eight glacial–interglacial cycles
Plotted across the full 800,000 years, both records march in a striking sawtooth: a slow, ragged slide into each glacial maximum followed by an abrupt termination into a warm interglacial. The interglacials are the odd-numbered marine isotope stages (MIS) — our own Holocene is MIS 1, the last interglacial (the Eemian, ~123 kyr ago) is MIS 5.
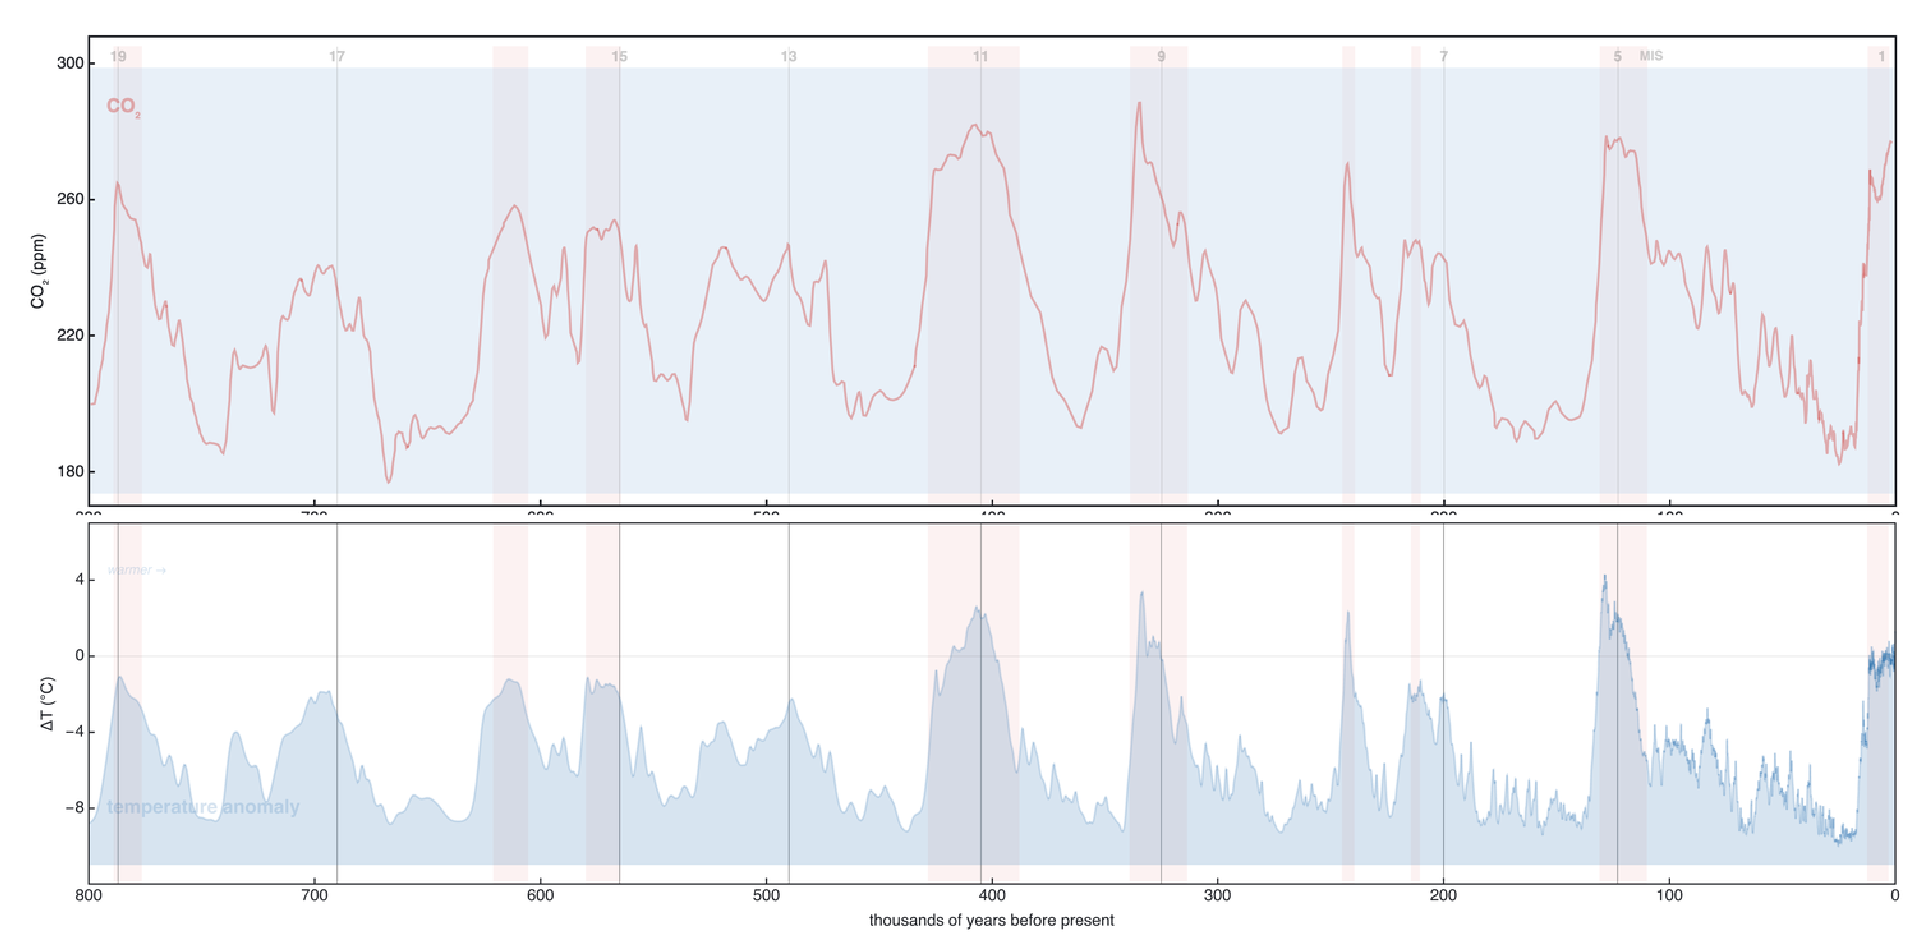
CO₂ (top) and Antarctic temperature (bottom) over 800 kyr, present at right. Dotted guides mark the interglacial peaks (MIS stages, after the LR04 chronology); the grey band is the natural CO₂ range. The two curves rise and fall almost in lockstep.
Watch the record assemble itself, oldest to youngest — and then watch the present arrive:
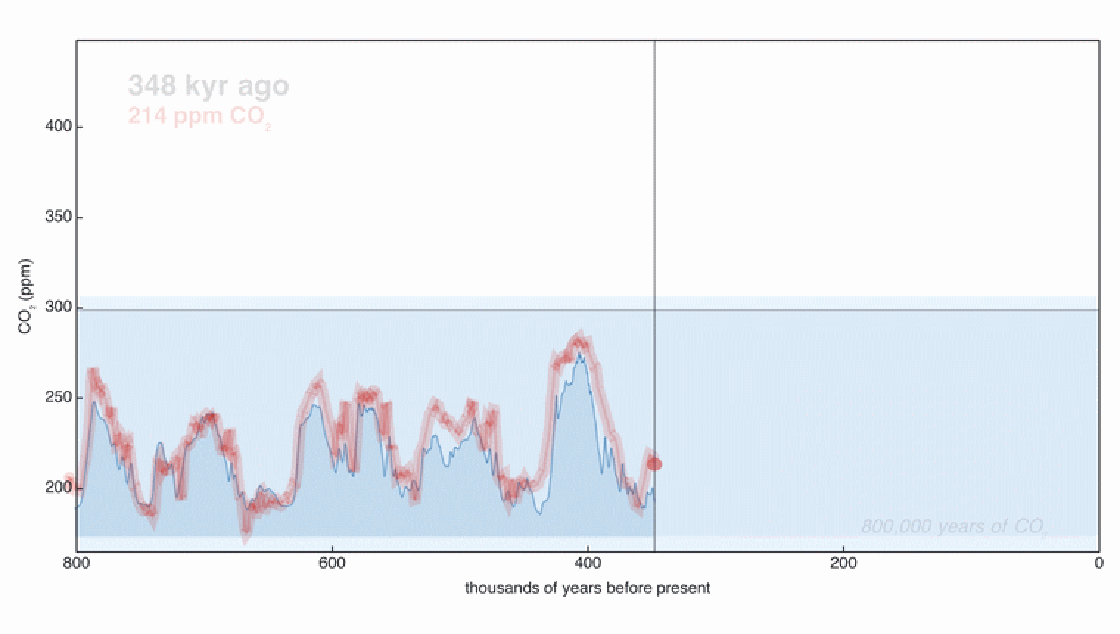
Sweeping through 800,000 years. The ice-core CO₂ stays inside its band for the whole record; only at the very end does the instrumental curve leave the chart.
3. The 100,000-year rhythm
3. The 100,000-year rhythm
The cycles are not random. Taking a power spectrum of each record — resampling to an even 2-kyr grid, detrending, Hann-windowing and an FFT — concentrates the power at the Milankovitch periods of Earth's orbit:
◼
~100 kyr — eccentricity (the shape of Earth's orbit);
◼
~41 kyr — obliquity (the tilt of its axis);
◼
~19–23 kyr — precession (the wobble of the axis).
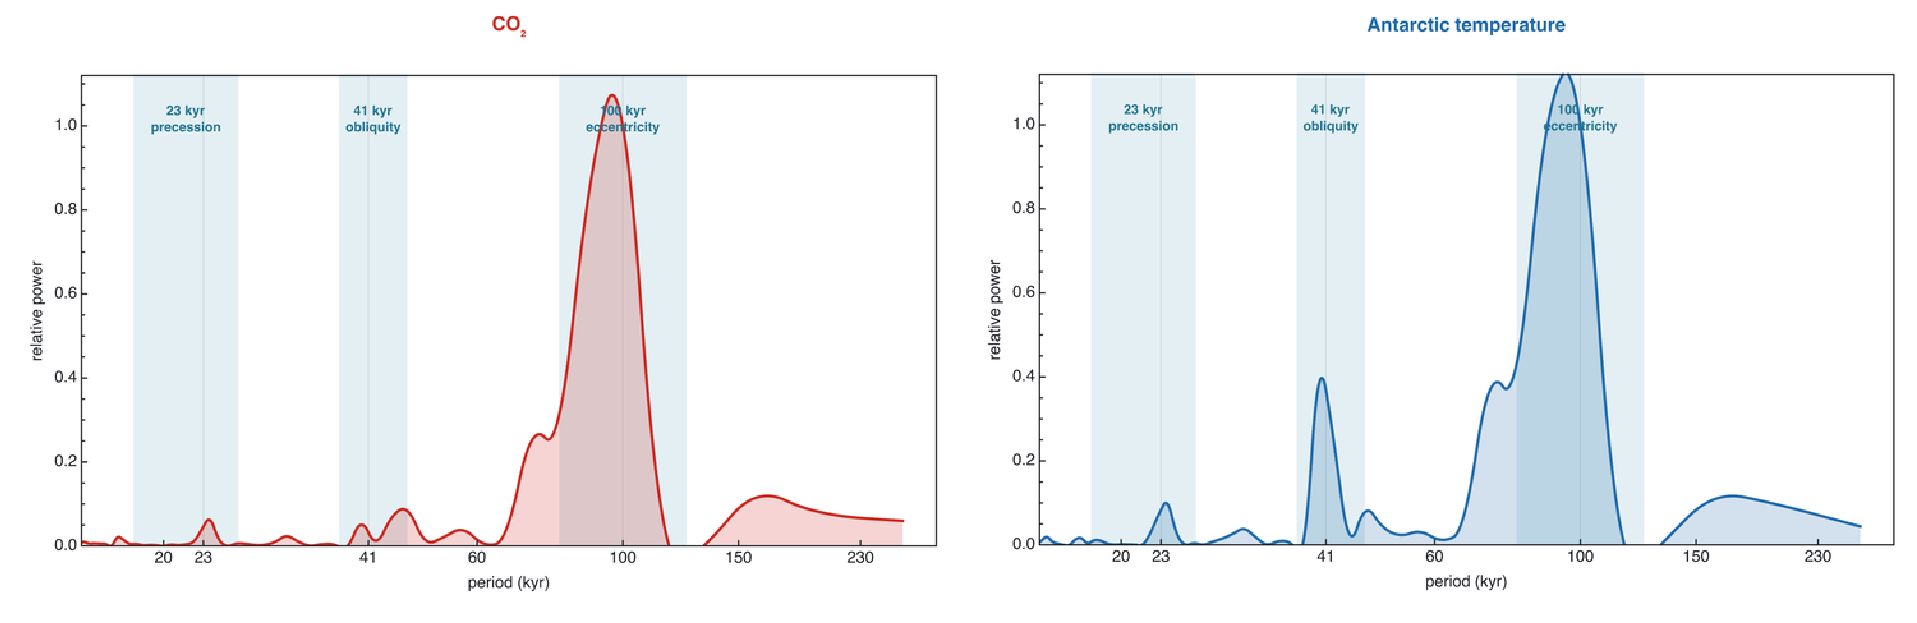
Power spectra of CO₂ (left) and Antarctic temperature (right). CO₂ is dominated by the ~100 kyr eccentricity band; temperature carries both the 100 kyr and a strong ~41 kyr obliquity peak, with a precession bump near 23 kyr.
The late-Pleistocene cycles are paced near 100 kyr. This is the famous "100 kyr problem": the eccentricity forcing is itself weak, so the dominant 100 kyr beat reflects eccentricity-modulated pacing amplified by ice-sheet and carbon-cycle feedbacks rather than direct orbital energy. Temperature's strong 41 kyr peak is the fingerprint of axial tilt. (These are simple illustrative periodograms — enough to reveal the bands, not formal red-noise significance tests.)
4. The orbital pacemakers
4. The orbital pacemakers
We can rebuild the pacemakers themselves. From the La2004 astronomical solution (Laskar et al. 2004) we take eccentricity, obliquity and the longitude of perihelion, and compute the classic orbital pacing index — the 65°N summer-solstice daily-mean insolation (Berger 1978), the sunlight available to melt northern ice sheets (a pacing index, not the sole driver — feedbacks and ice-sheet dynamics matter too):
Q=(sinϕsinδ+cosϕcosδsin)
S
π
2
a
r
H
0
H
0
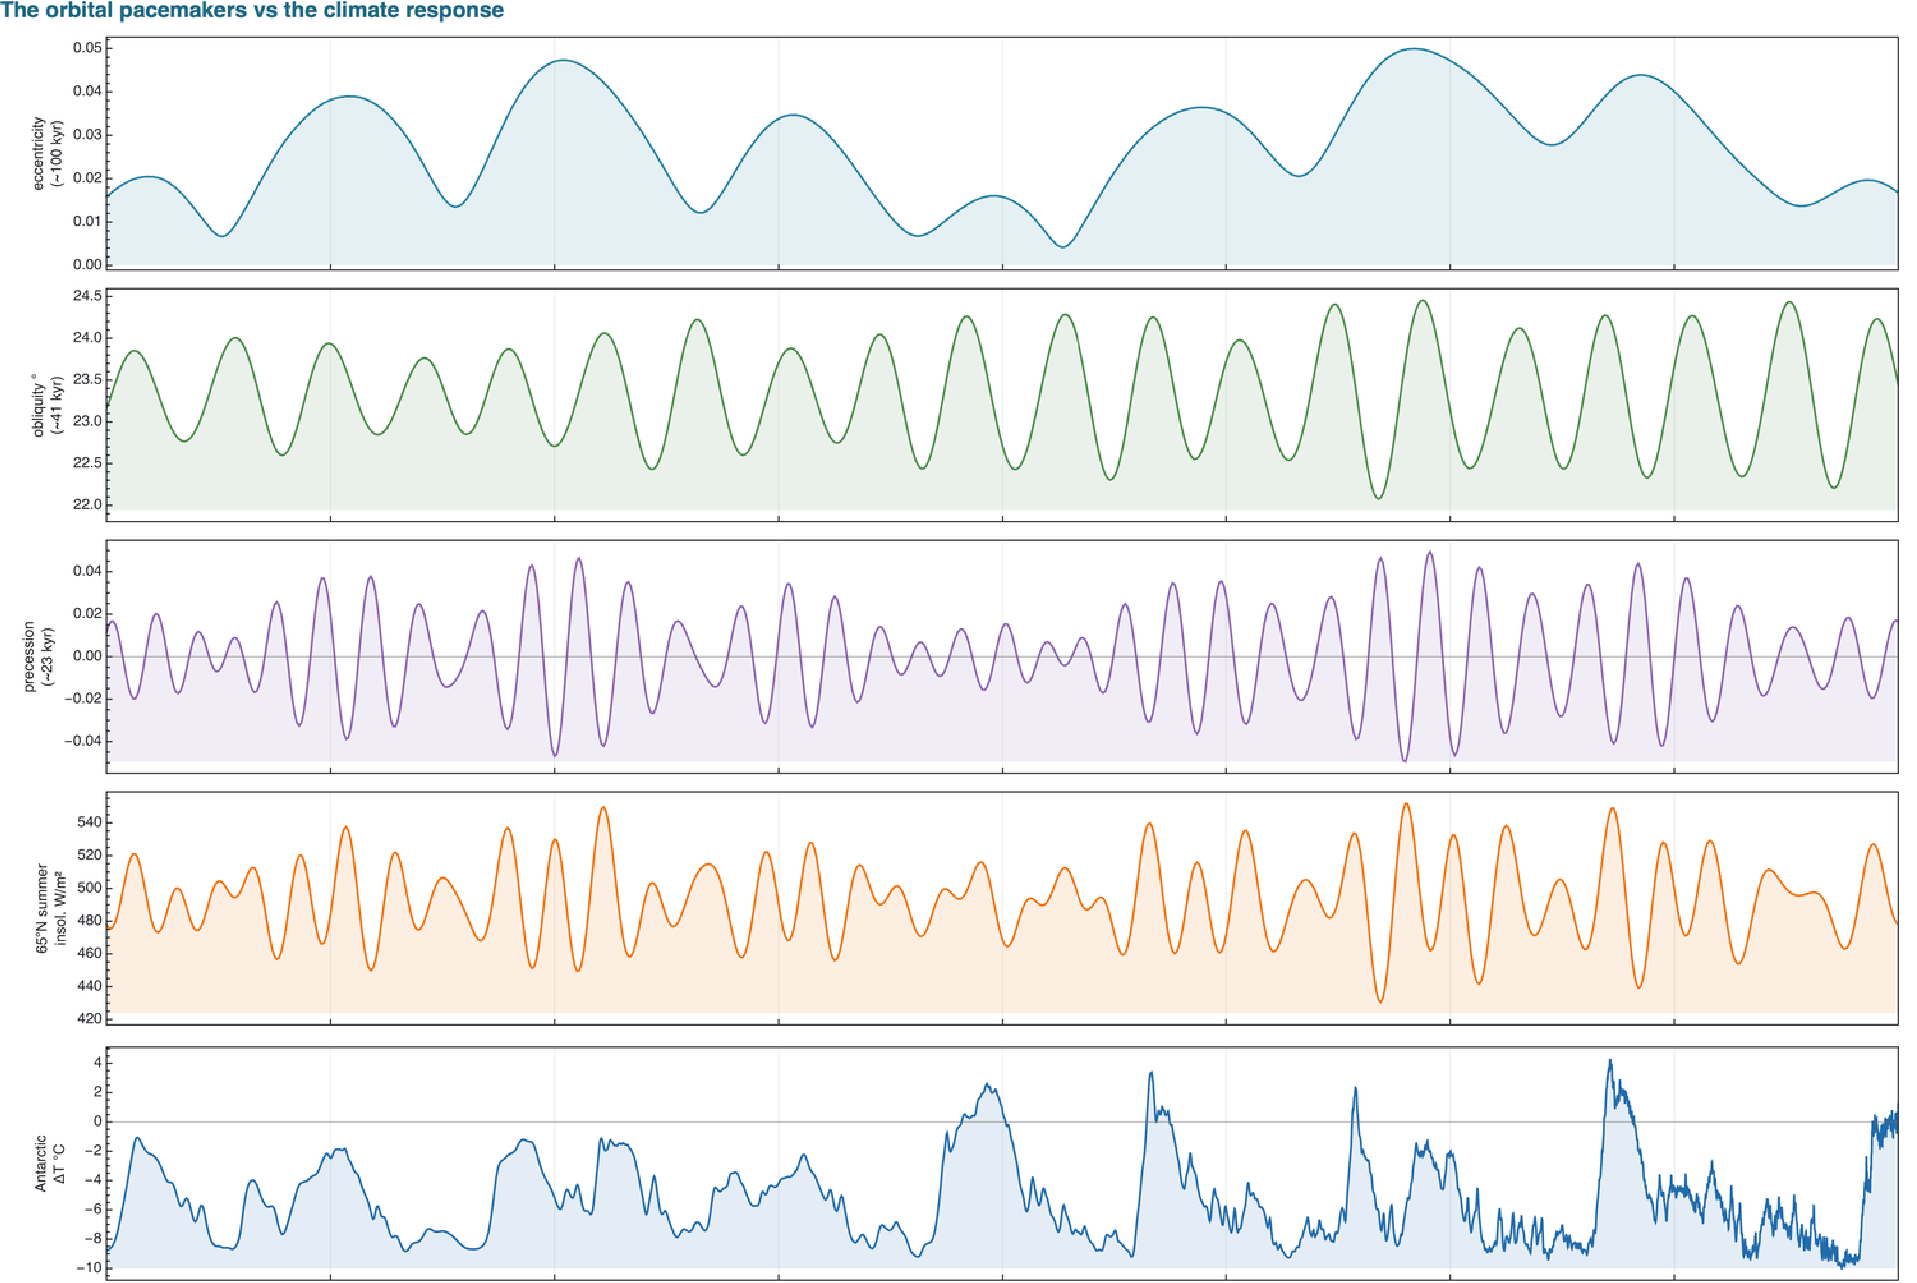
The La2004 orbital parameters — eccentricity (~100 kyr), obliquity (~41 kyr), climatic precession (~23 kyr) — and the computed 65°N summer insolation, above the Antarctic temperature response. Present at right.
⚠
5. The tight CO₂–temperature coupling
5. The tight CO₂–temperature coupling
Plotting CO₂ against temperature, with the 800-kyr trajectory coloured by age, the natural climate states collapse onto a tight diagonal — a linear fit gives roughly 8 ppm of CO₂ per °C of Antarctic change (a descriptive slope, not a physical sensitivity). Glacial and interglacial worlds are two ends of one well-worn groove.
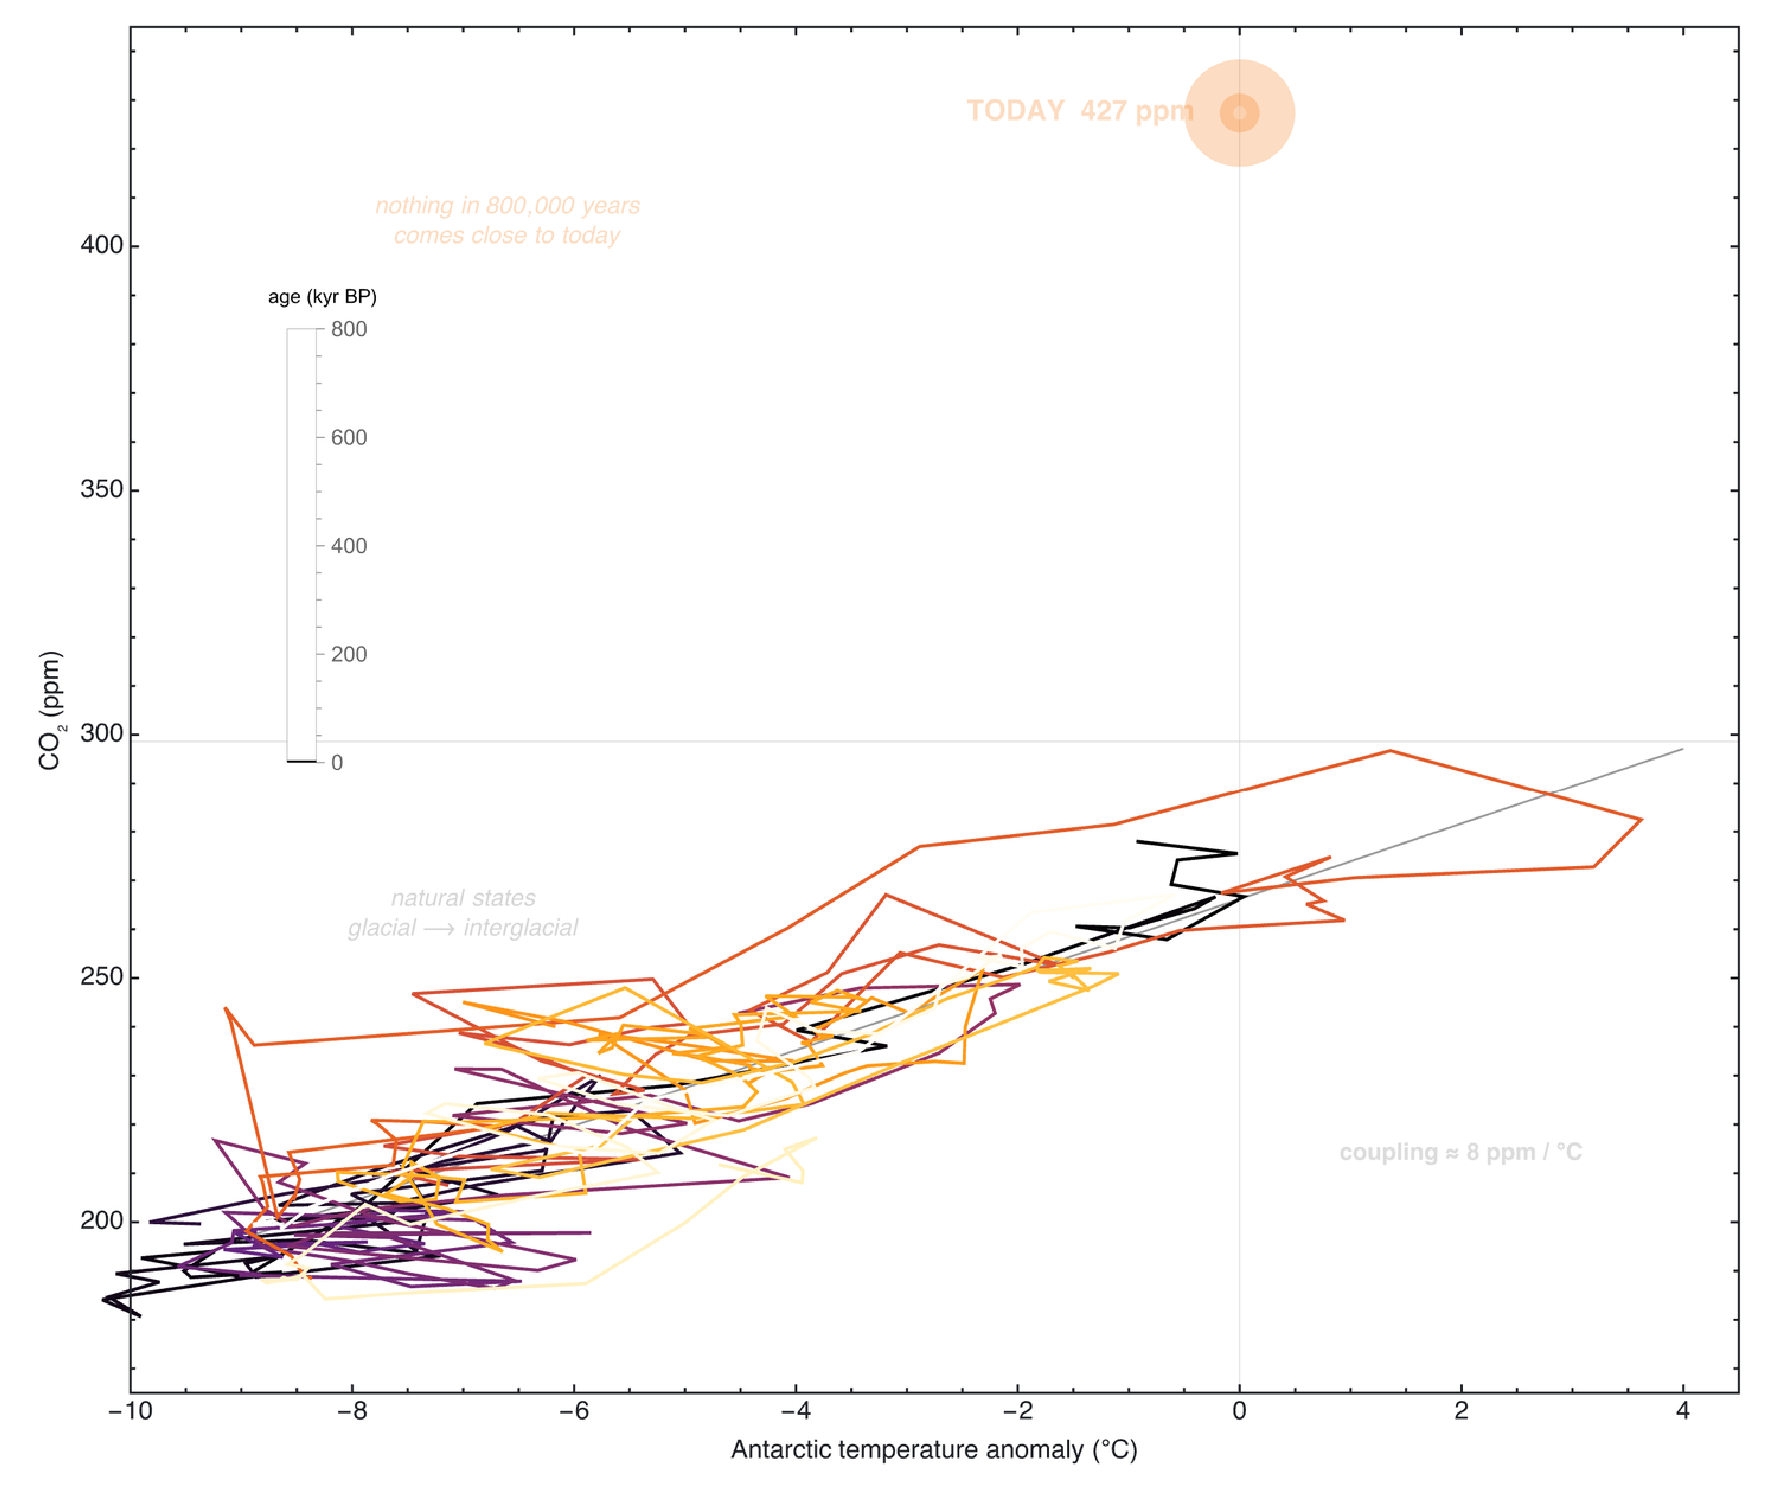
CO₂ versus Antarctic temperature anomaly; the path is coloured from oldest (dark) to youngest. Every one of the last eight cycles lives in the same diagonal cloud — and today's CO₂ sits far above all of it.
And then there is today. The orange point floats high above a phase space that 800,000 years of natural variability never came close to entering.
6. Does CO₂ lead or follow temperature?
6. Does CO₂ lead or follow temperature?
If the two are so tightly coupled, which moves first? Two standard tools answer this — lagged cross-correlation in the time domain, and cross-spectral phase in the frequency domain. On our resampled records the cross-correlation peaks at r ≈ 0.89 essentially at zero lag, and the phase at every Milankovitch band (100, 41, 23 kyr) sits within ~1 kyr of zero, with high coherence.
Left: lagged cross-correlation of CO₂ and temperature — a smooth peak at essentially zero lag (positive = CO₂ leads). Right: cross-spectral phase as a lag at each Milankovitch band; all three sit within ~1 kyr of zero — the scale of the gas-/ice-age chronology offset — with coherence γ² labelled.
The clearest way to see it is to zoom into the deglaciations themselves. Overlaying CO₂ and Antarctic temperature (each normalised within the window) across the last two terminations, the two rise essentially together — so close that the order of the first few centuries is, in these records, lost inside the Δage uncertainty rather than plainly visible.
The last two deglaciations, CO₂ (red) and Antarctic temperature (blue) on a common grid with identical smoothing, each normalised within the window, younger at right. A shape comparison (not a timing measurement): they climb almost on top of each other, any residual offset being within the gas-/ice-age chronology offset.
7. The modern breakout
7. The modern breakout
Over the whole ice-core record, CO₂ ranged from about 174 ppm in the depths of glacials to about 299 ppm in the warmest interglacials. In 2025 the instrumental Mauna Loa value was 427 ppm — roughly 128 ppm above the highest natural level in 800,000 years.
The rate is as startling as the level. The natural deglacial rise out of the last ice age — about 90 ppm — took some ten thousand years (~0.01 ppm/yr). The rise since ~1850 has run more than seventy times faster.
The last 24,000 years. The gradual deglacial rise of CO₂ (red) gives way to the near-vertical instrumental "blade" (orange) to today's value — off the top of the natural band.
Seen as a gauge filling through time, the picture is visceral: the column tracks the natural band for the entire record, then bursts straight through the ceiling.
A CO₂ gauge swept through 800,000 years. Crimson is the natural range; the orange is the present-day excess that carries CO₂ far past anything in the record.
8. Beyond the ice: five million years
8. Beyond the ice: five million years
The ice cores stop at 800 kyr, but the LR04 benthic δ¹⁸O stack (Lisiecki & Raymo 2005) — a global proxy for ice volume and deep-ocean temperature — reaches back 5.3 million years. It exposes a striking change in the climate's rhythm: before about 1 million years ago the world ran on a ~41 kyr (obliquity) beat; afterwards it switched to the ~100 kyr rhythm of our eight cycles. This is the Mid-Pleistocene Transition.
Top: 5.3 Myr of LR04 benthic δ¹⁸O (warmer up), present at right; the cycles grow larger and longer across the Mid-Pleistocene Transition (shaded). Bottom: power spectra in two windows recover the switch — a 41 kyr peak before the transition, a 100 kyr peak after.
Re-running our spectrum in two windows recovers it directly: before the transition the dominant period is ~41 kyr; after it is ~100 kyr — the same beat we measured in the ice cores.
How unusual is 427 ppm on the longest view? Beyond the ice we rely on discontinuous old ice (Allan Hills, ~2 Myr; Yan et al. 2019) and geochemical proxies — boron isotopes, alkenones, fossil-leaf stomata — synthesised across the Cenozoic by the CenCO₂PIP project (Hönisch et al. 2023) and across the wider Phanerozoic by Foster, Royer & Lunt (2017). On a logarithmic time axis the whole sweep fits in one frame — out to the Cretaceous greenhouse ~100 million years ago, when CO₂ ran near 1,000–1,500 ppm.
CO₂ from 10 kyr to 150 Myr on log axes (curated published estimates beyond the ice; see caveat). The narrow ice-core band (blue) and Allan Hills ice (red) stay below ~300 ppm; geochemical proxies (blue, with uncertainties) climb past the Eocene hothouse to the Cretaceous greenhouse. The K–Pg boundary (66 Ma) is marked. Today's level (orange line) was last seen, within proxy uncertainty, in the mid-Pliocene ~3 million years ago.
10. Conclusions
10. Conclusions
From Antarctic ice and the records that reach beyond it, the picture is clear:
◼
CO₂ and Antarctic temperature have cycled together through eight glacial–interglacial cycles over 800,000 years, tightly coupled (~8 ppm/°C).
◼
Those cycles are paced by Earth's orbit — the 100 / 41 / 23 kyr Milankovitch bands appear directly in the spectra, and the Mid-Pleistocene Transition from a 41 kyr to a 100 kyr world is visible in the 5-Myr LR04 record.
◼
Lead/lag analysis shows the two are essentially in phase within the chronological uncertainty; CO₂ is the great amplifier of orbitally-paced change and globally leads temperature.
◼
Today's CO₂ is entirely outside the 800,000-year experience — and was last sustained ~3 million years ago, in a far warmer, higher-sea world.
11. Data & methods
11. Data & methods
All pure Wolfram Language. Every record except the deep-time CO₂ panel is fetched live with URLRead, cached as CSV, and loaded by a shared package; the §9 deep-time CO₂ points are hand-compiled from the cited literature (flagged there). Figures display age as 800 - age so the present is at the right; spectra resample to an even grid before the FFT; lead/lag uses lagged correlation and a smoothed cross-spectrum; insolation follows Berger (1978).
◼
CO₂ (800 kyr): Bereiter et al. (2015), Antarctic composite (NOAA WDS Paleo).
◼
Temperature: Jouzel et al. (2007), EPICA Dome C deuterium temperature, EDC3 scale (NOAA WDS Paleo).
◼
Modern CO₂: NOAA Global Monitoring Laboratory, Mauna Loa & global annual means.
◼
Orbital forcing: Laskar et al. (2004), La2004 solution (IMCCE).
◼
Deep-time temperature: Lisiecki & Raymo (2005), LR04 benthic δ¹⁸O stack (NOAA WDS Paleo).
◼
Deep-time CO₂: Yan et al. (2019, Allan Hills), CenCO₂PIP (Hönisch et al. 2023) and Foster, Royer & Lunt (2017, Phanerozoic) — curated published estimates (see §9 caveat).
12. References
12. References
Bereiter, B. et al. (2015). Revision of the EPICA Dome C CO₂ record from 800 to 600 kyr before present. Geophys. Res. Lett. 42, 542–549.
Jouzel, J. et al. (2007). Orbital and millennial Antarctic climate variability over the past 800,000 years. Science 317, 793–796.
Laskar, J. et al. (2004). A long-term numerical solution for the insolation quantities of the Earth. Astron. Astrophys. 428, 261–285.
Lisiecki, L. E. & Raymo, M. E. (2005). A Pliocene-Pleistocene stack of 57 globally distributed benthic δ¹⁸O records (LR04). Paleoceanography 20, PA1003.
Berger, A. L. (1978). Long-term variations of daily insolation and Quaternary climatic changes. J. Atmos. Sci. 35, 2362–2367.
Caillon, N. et al. (2003). Timing of atmospheric CO₂ and Antarctic temperature changes across Termination III. Science 299, 1728–1731.
Parrenin, F. et al. (2013). Synchronous change of atmospheric CO₂ and Antarctic temperature during the last deglacial warming. Science 339, 1060–1063.
Shakun, J. D. et al. (2012). Global warming preceded by increasing CO₂ during the last deglaciation. Nature 484, 49–54.
Yan, Y. et al. (2019). Two-million-year-old snapshots of atmospheric gases from Antarctic ice. Nature 574, 663–666.
Hönisch, B. et al. (2023). Toward a Cenozoic history of atmospheric CO₂. Science 382, eadi5177.
Foster, G. L., Royer, D. L. & Lunt, D. J. (2017). Future climate forcing potentially without precedent in the last 420 million years. Nature Communications 8, 14845.
13. Acknowledgements
13. Acknowledgements
This notebook rests entirely on measurements generously made public by others. The Dome C records are the work of the EPICA community and the investigators cited above; the orbital solution is from the IMCCE (Laskar and colleagues); the deep-time compilations are the work of the CenCO₂PIP consortium and the authors cited in §9. Data were obtained from the NOAA World Data Service for Paleoclimatology and the NOAA Global Monitoring Laboratory, whose long-term archiving makes work like this possible. All analysis, figures and animations are pure Wolfram Language.
CITE THIS NOTEBOOK
CITE THIS NOTEBOOK
800,000 years of climate from ice cores: CO₂, temperature, and the rhythm of the ice ages
by Marco Thiel
Wolfram Community, STAFF PICKS, June 10, 2026
https://community.wolfram.com/groups/-/m/t/3731409
by Marco Thiel
Wolfram Community, STAFF PICKS, June 10, 2026
https://community.wolfram.com/groups/-/m/t/3731409