Campi Flegrei is a volcanic caldera in southwest Italy, just west of Naples and Mount Vesuvius. It contains a couple of distinct volcanoes within the larger caldera. Based on geological records, this caldera is not technically classified as a supervolcano, though the term is often used by the media for any caldera volcano. The geological record doesn’t indicate there has ever been an eruption from this caldera large enough to classify as a supervolcano, with a volcanic explosive index (VEI) of 8 that would expel 1,000 cubic kilometers of volcanic material. The record shows the largest eruption marks this as a major volcano with a VEI of 7, expelling on the order of 200 cubic kilometers of volcanic material, but this was about 39,000 years ago. An eruption of this magnitude would cover much of eastern Europe in ash. The last major eruption was in 1538, the result of which was Monte Nuovo.
In[]:=
EntityList

Out[]=
,
In[]:=
ResourceFunction["GeoInsetMap"]
Out[]=
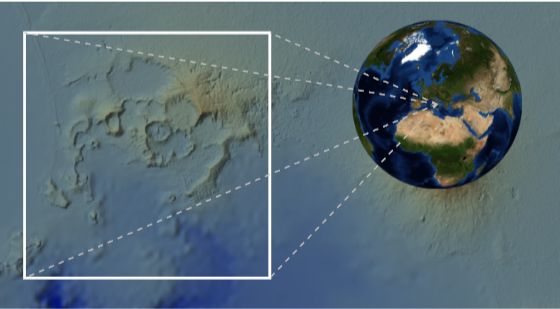
Recent news has been covering an ongoing series of earthquake swarms and ground swelling in Campi Flegrei, some of which are large enough to cause concern among local inhabitants of the area. Earthquakes can be caused by several sources, primarily tectonic or magmatic. Tectonic earthquakes are more familiar to most people and are caused by tectonic plates moving with respect to each other and sudden releases of energy due to the buildup and release of energy caused by sudden movement along fault planes. But earthquakes can also be caused by the movement of magma under the surface. As magma rises in volcanic regions and intrudes into local rocks and displaces it, or increases pressure due to volcanic gasses entering the hydrological system, the result can be a series of earthquakes. Ground swelling and contraction, called Bradyseism, can stress local rocks beyond the elastic limits and cause breaks, resulting in these earthquakes. When there is an abnormally large number of these it is called an earthquake swarm.
Due to the large number of low magnitude earthquakes, a 3rd party data source provides more complete coverage than USGS sources. The following site provides a data feed of the earthquakes measured in the area of interest over the past year.
In[]:=
json=Import["https://terremoti.ov.ingv.it/gossip/flegrei/events.json"];
The data can be structured into something more computable as follows.
In[]:=
rawQuakeData=With[{loc="location"/.#,mag="magnitudos"/.#,depth="depth"/.#,date="date"/.#},{"value"/.mag[[1]],GeoPosition[{"latitude"/.loc,"longitude"/.loc,-1000.("depth"/.loc),AbsoluteTime[date]}]}]&/@Select[json,!FreeQ[#,Rule["location",_]]&&!FreeQ[#,Rule["magnitudos",_]]&&!FreeQ[#,Rule["depth",_]]&&!FreeQ[#,Rule["date",_]]&];
At the time of this post, the coverage of data starts in spring of 2023.
In[]:=
FromAbsoluteTime/@MinMax[rawQuakeData[[All,2]][[All,1,4]]]
Out[]=
,
Most of the earthquakes are less than magnitude 2, but a handful have reached magnitude 4:
In[]:=
Histogram[rawQuakeData[[All,1]],PlotRange->All]
Out[]=
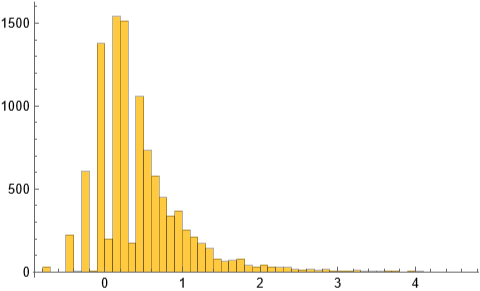
There have been over 9000 earthquakes since the start of data monitoring.
In[]:=
rawQuakeData//Length
Out[]=
10591
Due to the enormous number of earthquakes with magnitude less than 1, its useful to extract only those with magnitude greater than 1.
In[]:=
quakeData=Select[Thread[rawQuakeData[[All,2]]->rawQuakeData[[All,1]]],#[[2]]>=1&];
This reduces the count to over 1300 earthquakes.
In[]:=
quakeData//Length
Out[]=
1390
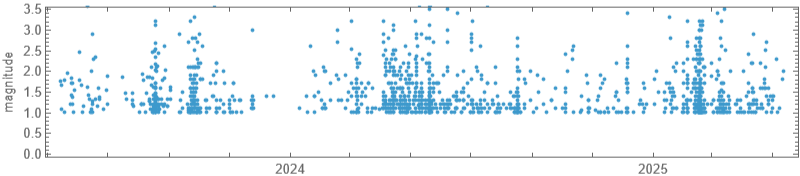
The magnitude of quakes as a function of time can be plotted.
In[]:=
DateListPlot[{FromAbsoluteTime[#[[1]]],#[[2]]}&/@Transpose[{quakeData[[All,1,1,4]],quakeData[[All,2]]}],Joined->False,AspectRatio->.2,ImageSize->600,PerformanceGoal->"Speed",FrameLabel->{None,"magnitude"}]
Out[]=
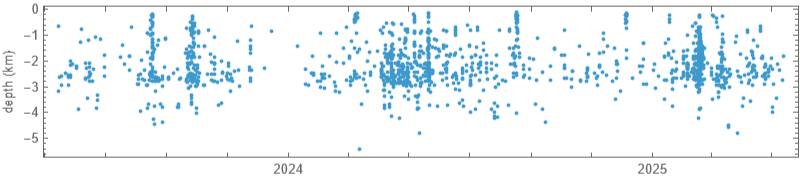
Also, the depth of the earthquakes as a function of time can be plotted.
In[]:=
DateListPlot[{FromAbsoluteTime[#[[1]]],#[[2]]/1000}&/@quakeData[[All,1,1]][[All,{4,3}]],Joined->False,AspectRatio->.2,ImageSize->600,PerformanceGoal->"Speed",FrameLabel->{None,"depth (km)"}]
Out[]=
The epicenters of the earthquakes can be visualized as follows. The black line shows the boundary of the city of Naples.
In[]:=
GeoGraphicsBlack,AbsoluteThickness[3],Line@@@["Polygon"],Red,Point[quakeData[[All,1]]],GeoBackground->GeoStyling["ReliefMap",BoxRatios->{1,1,.05}],GeoRange->Quantity[7,"Miles"],GeoCenter->["Position"][[2]],ImageSize->600
Out[]=
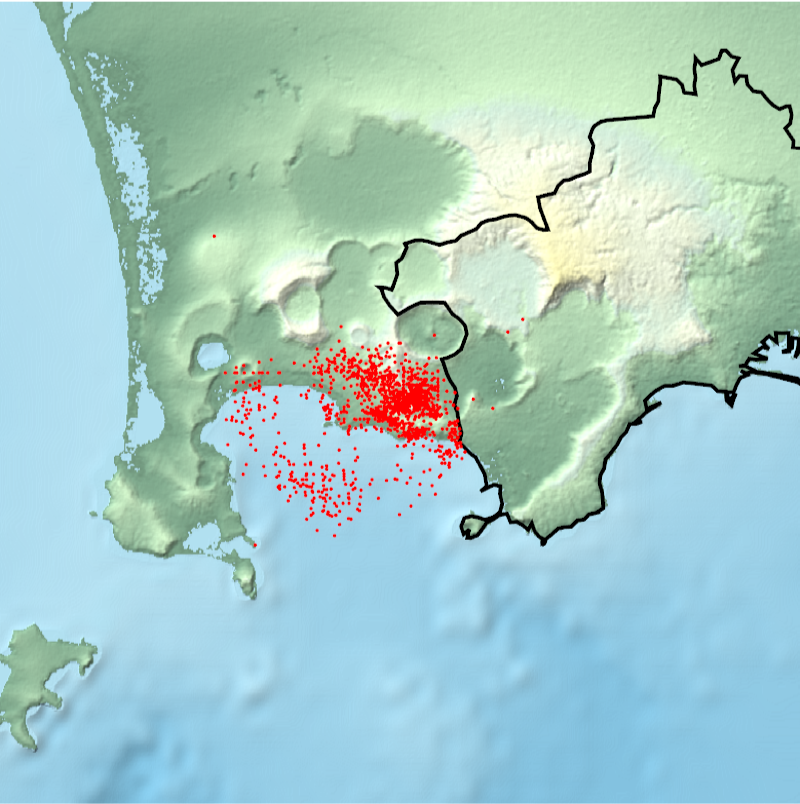
To better visualize the data, and not be drowned by the large number of smaller earthquakes, we can use GeoSmoothHistogram to provide a background region where most of the earthquakes manifest.
In[]:=
gsh=GeoSmoothHistogram[quakeData[[All,1]],ImageSize->600,Mesh->10,GeoBackground->"VectorMonochrome"]
Out[]=
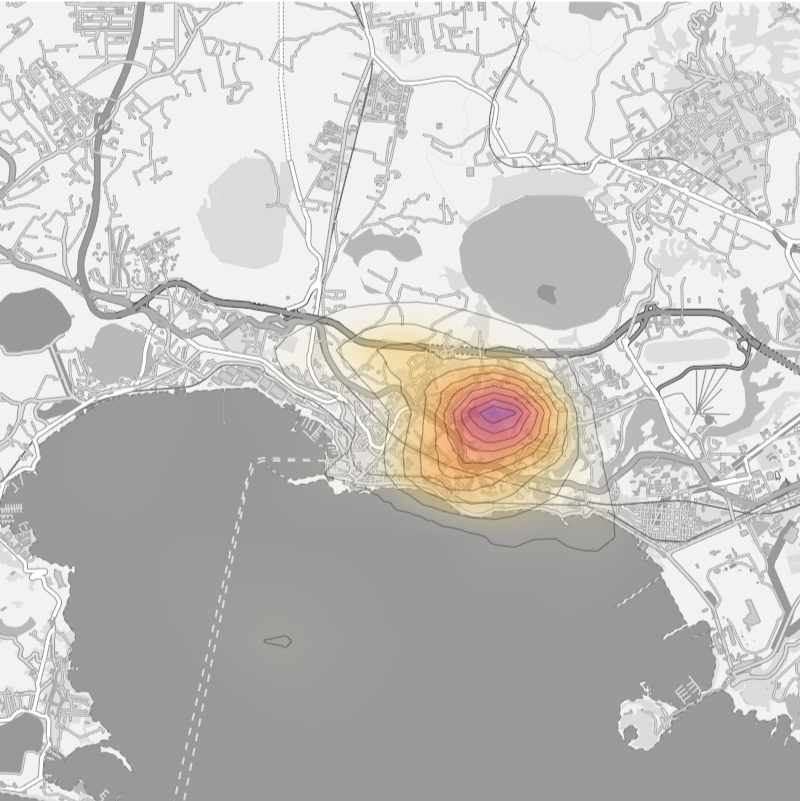
But to visualize the larger quakes in the region we can examine only those larger than magnitude 2.5. The largest earthquake at the time of this post is 4.6.
In[]:=
minmax=MinMax[Select[quakeData,#[[2]]>=2.5&][[All,2]]]
We can use GeoBubbleChart to plot these more significant earthquakes on top of the background created before.
3D Analysis
3D Analysis
The previous visualizations were all done in 2D. Its also possible to visualize this data in 3D. The first step is to convert all of the GeoPositions into GeoPositionXYZ values.
We want to view the region near the Solfatara volcano.
To create a 3D surface of the region of interest, we can use a Wolfram Function Repository item. This doesn’t just convert 2D polygon coordinates into 3D coordinates with z=0, it actually creates a 3D graphics primitive, with relief and on a spherical Earth.
Because the region is created for a spherical Earth, we need to make some adjustments for the fact that the Earth is not a perfect sphere.
Since we are zooming into a relatively small region, its more visually appealing to apply a texture to the surface to see the local features as they would actually appear. The zoom level is high to allow better visual appearance of small structures.
We can extract the earthquakes as 3D triples in meters with the following.
We can also represent the earthquakes as 3D spheres using both the 3D coordinates and magnitude values.
To provide an additional indicator of depth, its useful to duplicate the surface at 1km intervals to act like grid lines on a vertical axis.
To avoid additional noise in the final scene, we only want depth indicators for the primary landmass, ignoring the nearby islands.
Since the region sits on a globe, we can’t just use the z-axis for the “down” direction. Instead, we use the normal of the best fit plane to get a good approximation.
For the depth indicator layers, we want the simple region surface without the mountains and hills. We get this by creating a new mesh using the polygons on the underside of the region.
We want to selectively style the edges on the perimeter of each indicator layer. These edges can be found by checking for edges with only a single adjacent face.
Finally, we construct a GraphicsComplex representing the boundary of the base region. Essentially, the perimeter of the main region.
We can generate duplicates of the simplified region at 1km increments as follows. The elements include the boundary line and the inner region styled with a FaceForm.
Finally, we can assemble the scene.
The view can be changed with time and a video created.
It is not yet known at the time of this post whether a volcanic eruption is imminent for this region. Earthquakes continue as well as ground rising, due to Bradyseism, causing public concern and minor damage to pipes and infrastructure. At the time of this post, the ground is rising at a rate of about 2 to 3 cm per month. Historical records indicate the area has a history of both positive and negative Bradyseism meaning that ground rises and falls periodically. Is the ground swell due to magma, volcanic gasses, or perhaps a geothermal water reservoir? Will the ground continue rising at the current rate and lead to an eruption, or will it subside? Only time will tell.
CITE THIS NOTEBOOK
CITE THIS NOTEBOOK
Campi Flegrei (Phlegraean Fields): an active volcanic caldera west of Naples and Mount Vesuvius
by Jeffrey Bryant
Wolfram Community, STAFF PICKS, May 13, 2025
https://community.wolfram.com/groups/-/m/t/3459652
by Jeffrey Bryant
Wolfram Community, STAFF PICKS, May 13, 2025
https://community.wolfram.com/groups/-/m/t/3459652