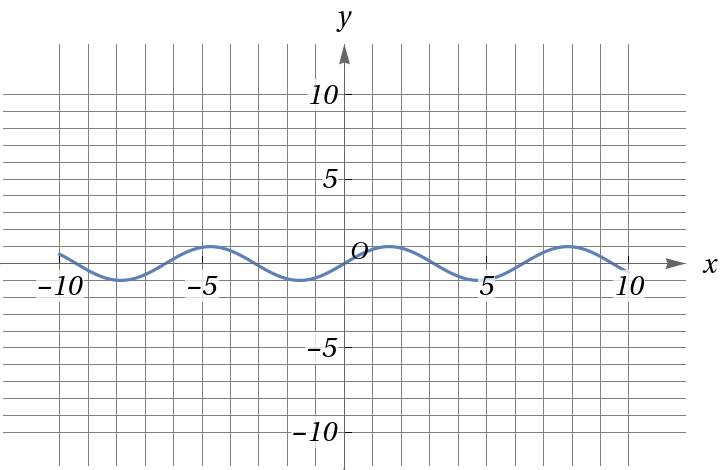
Plot[Sin[x],{x,-10,10},PlotRange{{-12,12},{-12,13}},AxesLabel{x,y},LabelStyleDirective[Black,14,Italic,FontFamily"Times New Roman"],AxesStyleArrowheads[{0.1,0.03}],GridLines{Range[-10,10,1],Range[-10,10,1]},GridLinesStyleDirective[Gray,Normal],Ticks{{-10,-5,5,10},{-10,-5,5,10}},TicksStyleDirective[Black,Plain,12,FontFamily"Times New Roman",BackgroundDirective[Opacity[0.75],White]],EpilogText[Style["O",Italic,FontSize12,FontFamily"Times New Roman"],{0.5,0.75}]]
origin.png