The idea behind this project is to design a set of tools to help visualise and analyse NFT market behaviour . The marketplace on [https://opensea.io/ ] will be our testing - ground.
API: Function(s) that handle database interactions, usually in the context of networks.
NFT: Type of contract on a Turing complete Blockchain.
CryptoPunks: Oldest collection of NFTs on the Ethereum blockchain.
API: Function(s) that handle database interactions, usually in the context of networks.
NFT: Type of contract on a Turing complete Blockchain.
CryptoPunks: Oldest collection of NFTs on the Ethereum blockchain.
Designing an API
Here we look at the page [ https://docs.opensea.io/reference ] in order to learn how to create a fully functional set of API connectors between the local machine and the OpenSea Server, so that we can request data from their database and do analytics on it and then use wolfram in-builts to do explorations on the data. Included are functions with examples on how to use them, and a larger more interesting example at the end of the chapter.
API Function Parameters
API Function Parameters
General Functions
General Functions
Example - Twitter Analytics: Buzzwords
Example - Twitter Analytics: Buzzwords
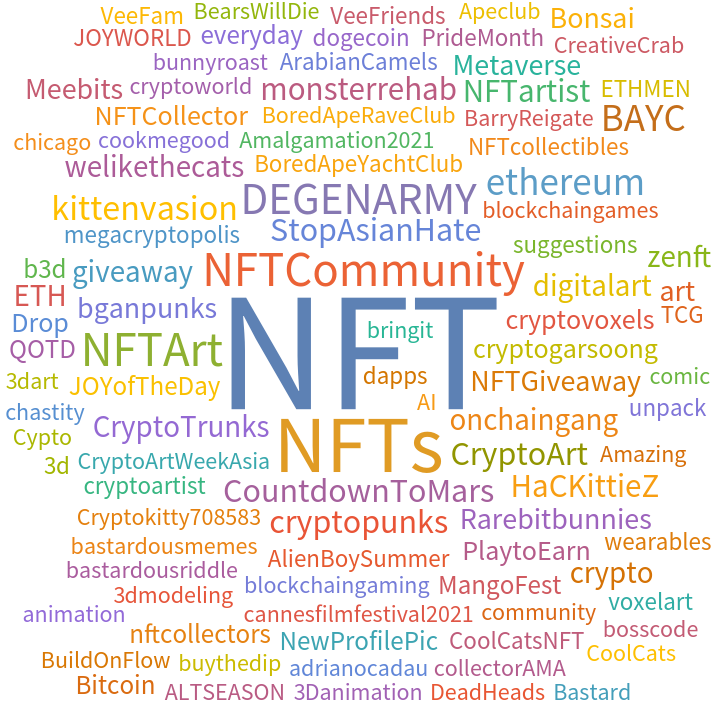
In the "getCollections" example, we found the twitter handles of various NFT minters. Lets take that a step further. It might be interesting to check out what the twitter crypto-space has on their mind. To do this, we parse the recent hashtags of all of the above NFT minters in order to find an interesting word cloud that summarises the most uttered phrase from this subset of the twitter crypto space.
In[]:=
addresses={"0xdf4c62f992ab29c3649db1fe65425c055b5c3913","0x863cd7e3268ee72656d9ccddc80ed446a7837c69","0x848fa9ec76391b94a83442170085f8ca863b1624","0xc6b0562605d35ee710138402b878ffe6f2e23807","0x9f79e17a35bf290925191245e1a1b4510d457497"};
users=DeleteDuplicates[Flatten[Table[Normal[DeleteCases[Dataset[Normal[twitterCreatorChannels[i]]],Null]],{i,addresses}]]];
Buzzword getter
Buzzword getter
In[]:=
twitter=ServiceConnect["Twitter","New"]
Out[]=
ServiceObject

In[]:=
hashtags=Table[twitter["UserHashtags","Username"->users[[i]]],{i,Length[users]}];
In[]:=
WordCloud[Flatten[hashtags]]
Out[]=
Creating a CryptoPunk Database
Here we outline a process to create a set of large databases so we have local access to image data and trade data of the cryptopunks, who are a collection of 10000 NFTs. They are the original NFT’s on the Ethereum blockchain and so will serve as a good test-case for the API functions. Included are some snapshots to show what each database looks like without having to download the files. If you would like to download the databases, they can be pulled from these addresses.
assetsDatabaseHyperlink=
https://www.wolframcloud.com/obj/0.kai.rharris/Published/assetsFullOrdered.wl
eventsDatabaseHyperlink=
https://www.wolframcloud.com/obj/0.kai.rharris/Published/CleanFULLEventsOrdered.wl
Events
Events
Events Snapshot
Events Snapshot
Assets
Assets
Similarly, the following method requests and cleans the getAssets data from OpenSea. This database will contain information that includes hyperlinks to the image URLs.
Getting the data
Getting the data
Loading the raw data
Loading the raw data
Processing function
Processing function
Processing all the raw data
Processing all the raw data
Sort and save clean data
Sort and save clean data
Test Data
Test Data
Assets Snapshot
Assets Snapshot
Using the Database
Now that we have a large database we want to use it to represent the data in a human understandable way. The following chapter is all about exploring this data and trying to make sense out of it. Further explanations are included within.
General NFT interest tracking over time
General NFT interest tracking over time
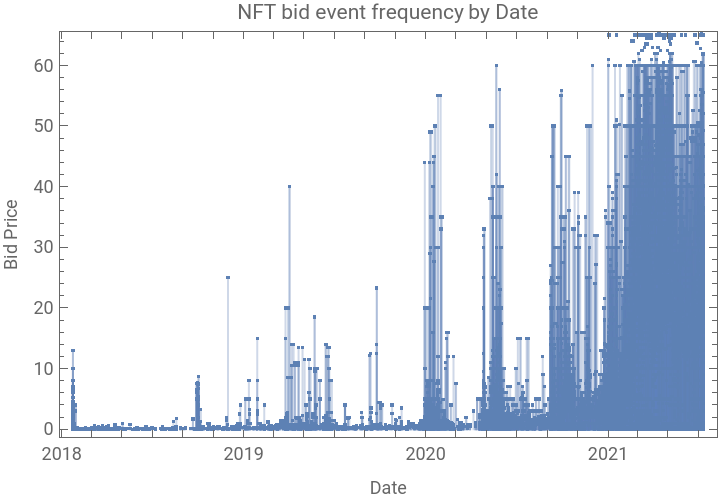
Using the events database, we can look at the market price fluctuations over the last few years.
Extracting Time-Series Data
Extracting Time-Series Data
Visualisation
Visualisation
DateListPlot[Activity,FillingBottom,JoinedFalse,FrameLabel{"Date","Bid Price"},PlotLabel"NFT bid event frequency by Date"]
Out[]=
Transaction graph: successful trades
Transaction graph: successful trades
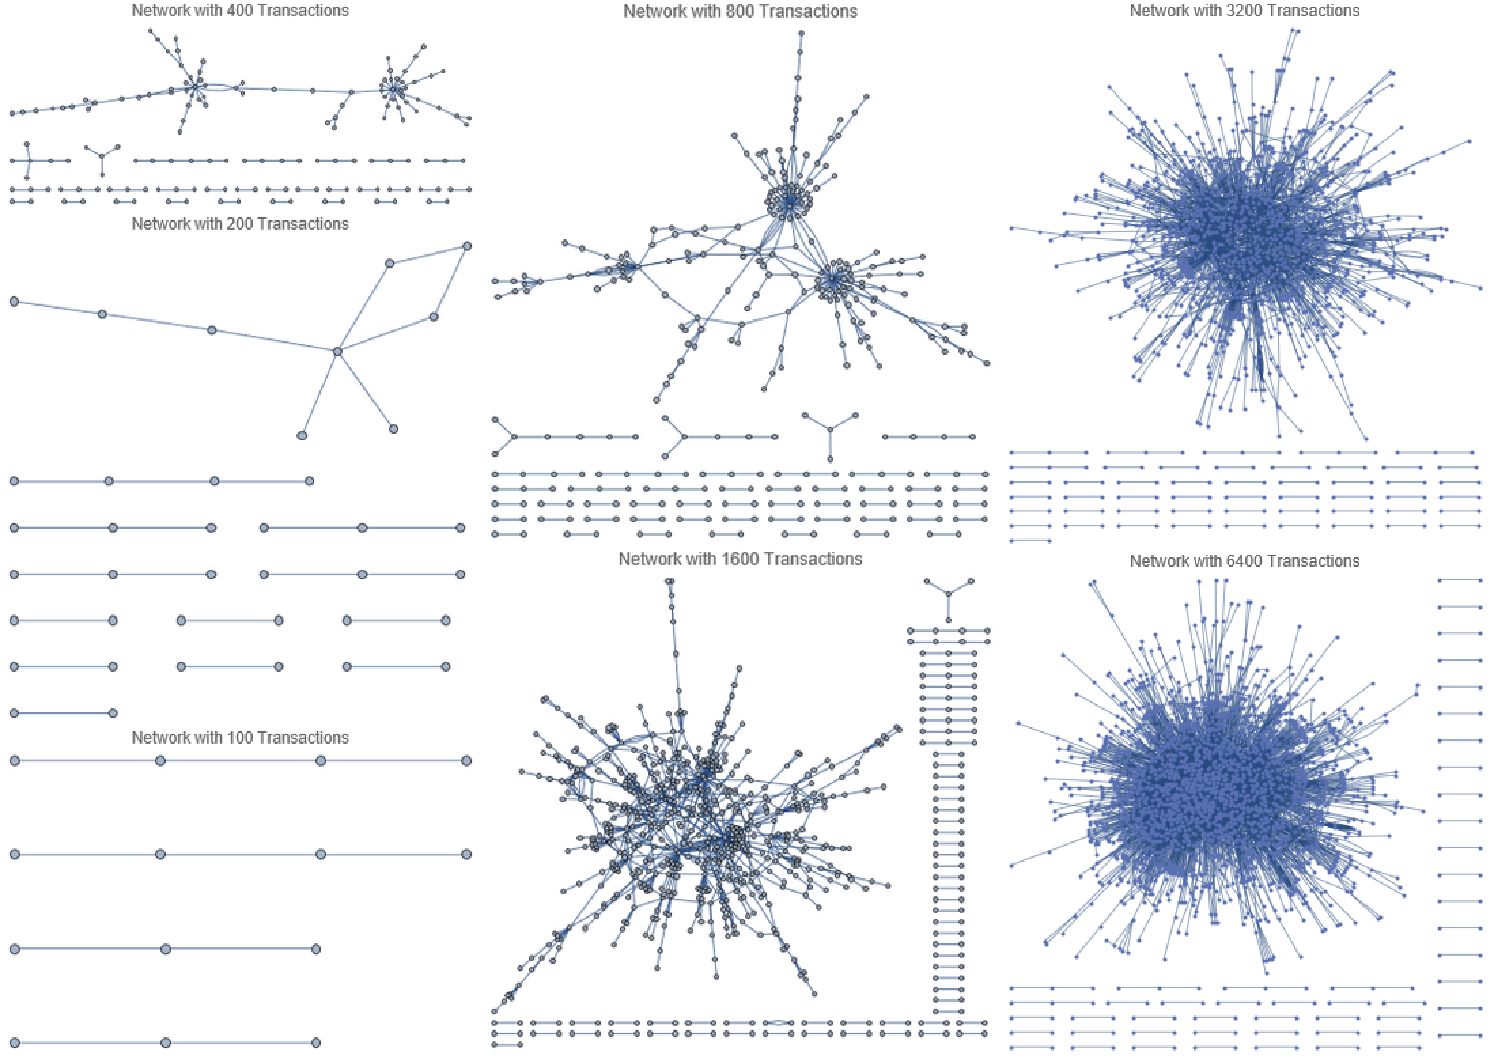
We can think of the transaction between parties as a graph of nodes and edges, where the nodes are each party and the edges represent a transaction. Here we look at the cryptopunk transaction graphs as we increase the number of observed in the dataset.
Helper functions
Helper functions
Transaction correspondence
Transaction correspondence
Visualisation
Visualisation
Using
In[]:=
Graph[graphFunc[sellers,buyers],PlotLabelStringInsert["Network with Transactions",ToString[dataSize],14]]
With
dataSize={100,200,400,800,1600,3600,6400}
We see that in the following transaction networks, the cleaning process removes many of the irrelevant data-points, and doubly linked nodes represent multiple trades between the same two parties.
images=Table[Export["D:\\image"<>ToString[i]<>".png",k[[i]]],{i,7}];
imagesI=Table[Import[images[[i]]],{i,7}];
In[]:=
ImageCollage[imagesI]
Out[]=
Machine Learning: price prediction based on image composition
Machine Learning: price prediction based on image composition
Not all crypto punks have been sold or bid for yet. The idea here is to look at the ones that have had interest and find the average price of the punk. Using this information, we create an association between the cryptopunks images and their average bid, and train a model, which we use to predict the market value of an unsold cryptopunk based on its image composition.
Train and Predict
Train and Predict
Training
Training
Create a correspondence between images by training id, and training bid prices. Train the model.
Testing
Testing
Import a unsold punk, and estimate its price.
Wider Scope
The NFT space is young, born in 2017. Who knows where it will go. In terms of this project, here are some thoughts about the future of the tech.
Whats next?
Whats next?
Index Tracker
Index Tracker
◼
A useful extension of this project would be an interactive index tracker using dynamic market data.This could then be utilised in some sort of an NFT exchange hub.Of course, the bottle neck is the speed of Ethereum network transactions. As blockchains become more optimised, perhaps it will be possible to create a low-latency trading platform for NFTs on newer technology.
Acknowledgment
Acknowledgment
Big thanks to Christian Pasquel, who schooled me on database cleaning techniques among other things; Jesse Friedman, who seems to know everything about Mathematica and answered almost all of my dumb questions; the TA’s who provided endless answers to many of us the rest of the time; the other students, for making this an awesome experience; Stephen himself, for providing much needed insight into a particularly odd personal dilemma of mine; and Danielle and Erin for gluing the rest of it all together!