In[]:=
port={"^GSPC","GLD","VCSH"};ret=FinancialData[#,"Return",{{2021,1,1},Date[]},"Value"]&/@port
Out[]=
TimeSeries,TimeSeries,TimeSeries


In[]:=
TimeSeries//Normal//Short
Out[]//Short=
,,,,165,,,,
In[]:=
portcor=Correlation[Transpose[ret]];TableForm[portcor,TableHeadings{port,port}]
Out[]//TableForm=
1.
Just guessing here as the documentation is of little help
Transpose -- does not work with TimeSeries as the result is the same three lists instead of two lists with three elements.
Correlation -- computes the relationship between the 1st element in the three lists which is
100% correlation because the comparison is being made on the date and all 3 lists have the same dates as the 1st element.
In[]:=
ret1=QuantityMagnitude[FinancialData[#,"Return",{2021}]["Values"]]&/@port;
In[]:=
Length[#]&/@{ret1[[1]],ret1[[2]],ret1[[3]]}
Out[]=
{169,169,169}
Got rid of the time stamp, the result is 3 lists with only 1 element (Return)
Transpose-- makes 1 list containing 3 elements.
Transpose-- makes 1 list containing 3 elements.
In[]:=
portcor=Correlation[Transpose[ret1]];TableForm[portcor,TableHeadings{port,port}]
Out[]//TableForm=
^GSPC | GLD | VCSH | |
^GSPC | 1. | 0.299461 | 0.314938 |
GLD | 0.299461 | 1. | 0.403923 |
VCSH | 0.314938 | 0.403923 | 1. |
Today -- the lists are of equal length (ret1) so no element was deleted, nearly the same results as with your method of deletion.
Below -- is the correlation when the first element of the first list was manually removed, yesterday.
Below -- is the correlation when the first element of the first list was manually removed, yesterday.
In[]:=
portcor=Correlation[Transpose[ret3]];TableForm[portcor,TableHeadings{port,port}]
Out[]//TableForm=
^GSPC | GLD | VCSH | |
^GSPC | 1. | 0.00840284 | 0.0375164 |
GLD | 0.00840284 | 1. | 0.403701 |
VCSH | 0.0375164 | 0.403701 | 1. |
In[]:=
ret1//Shallowret3//Shallow
Out[]//Shallow=
{{0.70826,0.570984,1.48474,0.549186,-0.655475,0.0415788,0.227564,-0.375345,-0.719003,0.813638,159},{0.296163,-1.62411,-0.233462,-3.42099,-0.196144,0.647396,-0.430737,-0.05191,-1.24076,0.847307,159},{-0.0480549,-0.0961469,-0.0240667,-0.0360996,-0.0601939,0.0602301,0.0963065,-0.0481069,0.,0.0240605,159}}
Out[]//Shallow=
{{0.570984,1.48474,0.549186,-0.655475,0.0415788,0.227564,-0.375345,-0.719003,0.813638,1.39356,158},{0.296163,-1.62411,-0.233462,-3.42099,-0.196144,0.647396,-0.430737,-0.05191,-1.24076,0.847307,158},{-0.0480549,-0.0961469,-0.0240667,-0.0360996,-0.0601939,0.0602301,0.0963065,-0.0481069,0.,0.0240605,158}}
only difference between ret1 and ret3 was element 0.70826, was removed from the 1st list
In[]:=
Transpose[ret]
Out[]=
TimeSeries,TimeSeries,TimeSeries
Transpose -- appears not to have done anything, the lists are the same
In[]:=
Transpose[ret1]//Shallow
Out[]//Shallow=
{{0.70826,0.296163,-0.0480549},{0.570984,-1.62411,-0.0961469},{1.48474,-0.233462,-0.0240667},{0.549186,-3.42099,-0.0360996},{-0.655475,-0.196144,-0.0601939},{0.0415788,0.647396,0.0602301},{0.227564,-0.430737,0.0963065},{-0.375345,-0.05191,-0.0481069},{-0.719003,-1.24076,0.},{0.813638,0.847307,0.0240605},159}
Transpose-- took 3 lists of 1 element and created 1 list of 3 elements
Hard to believe that by deleting the 1st day in one list could change a 30% correlation to a zero correlation.
Hard to believe that by deleting the 1st day in one list could change a 30% correlation to a zero correlation.
In[]:=
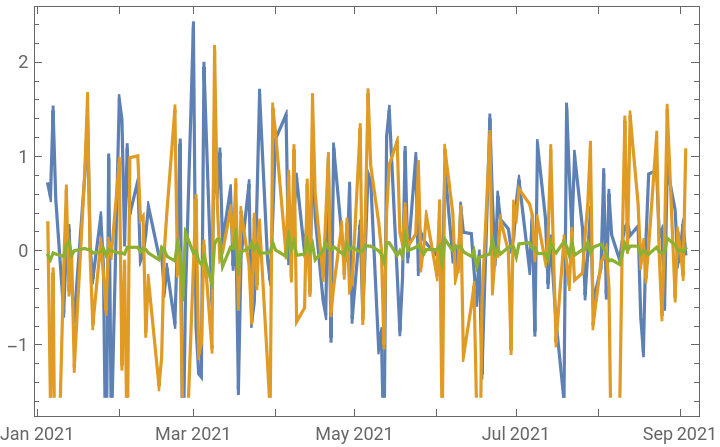
DateListPlot[ret,PlotLegendsAutomatic]
Out[]=


In[]:=
ListLinePlot[ret1,PlotLegendsAutomatic]
Out[]=
In[]:=
ListLinePlot[ret3,PlotLegendsAutomatic]
Out[]=
Return is the difference price changed from the day before
ret is the Return for 3 Stocks(ETFs) TimeSeries
ret1 is the Return for 3 Stocks(ETFs) with the Dates removed
ret3 is the same as ret1 except the 1st element in the 1st list was removed
I can not see any difference between ret1 and ret3, nor any correlation between the stocks in any of the plots -- correlation here is based on daily activity -- meaning if the 1st stock increases in value, then 30% of the time the other two stocks will also increase in value.
I could try a five day moving average and would except an 80% change -- .30*.8 = .24 correlation??
In[]:=
ret1MA5=Table[MovingAverage[ret1[[i]],5],{i,3}];Length[#]&/@{ret1MA5[[1]],ret1MA5[[2]],ret1MA5[[3]]}
Out[]=
{165,165,165}
In[]:=
portcor=Correlation[Transpose[ret1MA5]];TableForm[portcor,TableHeadings{port,port}]
Out[]//TableForm=
^GSPC | GLD | VCSH | |
^GSPC | 1. | 0.195888 | 0.306794 |
GLD | 0.195888 | 1. | 0.615672 |
VCSH | 0.306794 | 0.615672 | 1. |
In[]:=
ret3MA5=Table[MovingAverage[ret3[[i]],5],{i,3}];Length[#]&/@{ret3MA5[[1]],ret3MA5[[2]],ret3MA5[[3]]}
Out[]=
{164,164,164}
In[]:=
portcor=Correlation[Transpose[ret3MA5]];TableForm[portcor,TableHeadings{port,port}]
Out[]//TableForm=
^GSPC | GLD | VCSH | |
^GSPC | 1. | 0.0893597 | 0.188505 |
GLD | 0.0893597 | 1. | 0.615356 |
VCSH | 0.188505 | 0.615356 | 1. |
Improvement with averaging the deletion, from zero to 9% and 19% , compared to averaging no deletion 20% and 31% , compared to no averaging 30% and 31% correlation