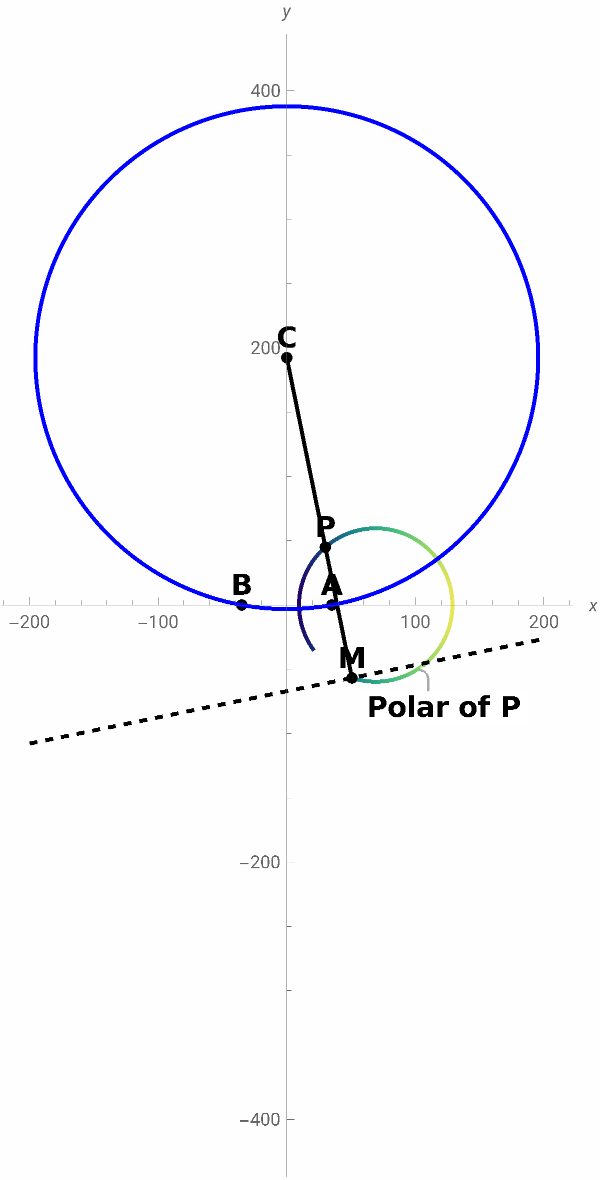
GeometricLocusMpolar::usage="Find the geometric locus of the point M of intersection of the polar of a fixed point P(γ, β), with respect to the circles that pass through two fixed points A(a, 0) and B(-a, 0) with the segment that joins P(γ, β) with the center of the circle. References: Carrillo Hoyo, Ángel et al. Lugares Geométricos. Instituto de Matemáticas, Facultad de Ciencias, UNAM; Personal.";
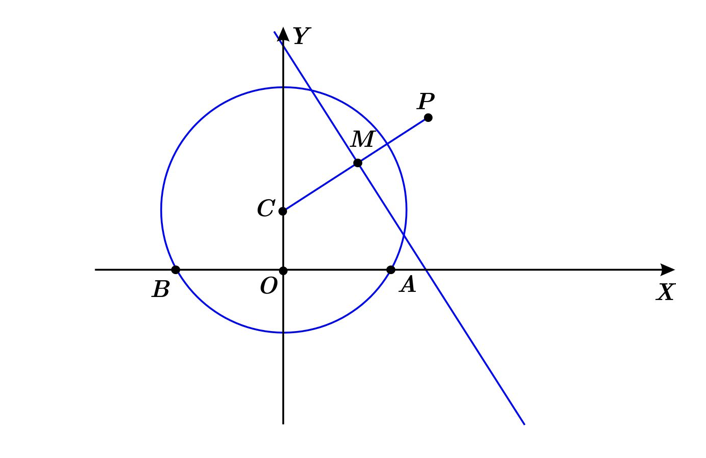
Development:
If we form a triangle with the upper intersection point of the polar with the circumference, the proportionality condition is met (r is the radius of circumference, the dstance of C to upper intersection point of the polar line with the circumference):
CP
r
r
CM
2
r
CP
CM
By the proportionality condition between vectors (for simplicity of the demonstration we are going to assume that C is at the origin):
CM
CP
2
CP
2
r
2
r
2
CP
2
r
2
x
2
y
2
r
2
x
2
y
But C = {,} it is not at the origin, so moving the axes:
x
0
y
0
M=++(x-),++(y-);
x
0
2
r
2
(x-)
x
0
2
(y-)
y
0
x
0
y
0
2
r
2
(x-)
x
0
2
(y-)
y
0
y
0
Note: For the inversion point M, the inversion coordinates were used and the values = 0, = t, a = 35, x = 30, y= 45
(the point P(x = γ, y =β)) were also used.
x
0
y
0
(the point P(x = γ, y =β)) were also used.
Animation:
In[]:=
ManipulateA={35,0};B={-35,0};C1={0,t1};P={30,45};r[t_]:=+;x1[t_]:=(30)+;y1[t_]:=t+(45-t)+;M[t_]:={x1[t],y1[t]};polar[x_]:=y1[t1]-(x-x1[t1]);Show[{ParametricPlot[M[t],{t,-200,t1},ColorFunction->"BlueGreenYellow"],Plot[Callout[polar[x],"Polar of P",{Scaled[0.75],Below},LabelStyle{14,Bold,Black}],{x,-200,200},PlotStyle{Black,Dashed}],Graphics[{Black,PointSize[0.020],Point[A],Text[Style["A",14,Bold],A,{0,-1.2}],Point[B],Text[Style["B",14,Bold],B,{0,-1.2}],Point[C1],Text[Style["C",14,Bold],C1,{0,-1.2}],Point[P],Text[Style["P",14,Bold],P,{0,-1.2}],Point[M[t1]],Text[Style["M",14,Bold],M[t1],{0,-1.2}],Thick,Line[{P,C1}],Line[{C1,M[t1]}],Blue,Circle[C1,r[t1]]}]},AspectRatioAutomatic,AxesTrue,AxesOrigin{0,0},AxesLabel{x,y},PlotRange{{-200,200},{-400,400}},ImageSize300],Style["Geometric locus of M ",Bold,Large],{{t1,-200+0.00002,"Value (t)"},-200+0.000001,200,0.00001},ControlPlacementTop
2
35
2
t
2
r[t]
2
30
2
(45-t)
2
r[t]
2
30
2
(45-t)
x1[t1]-30
y1[t1]-45
Out[]=