CITE THIS NOTEBOOK: World map of 1542 of Magellan & ElCano path: test of time & geo projections by Jose Martin-Garcia. Wolfram Community, SEP 30 2022
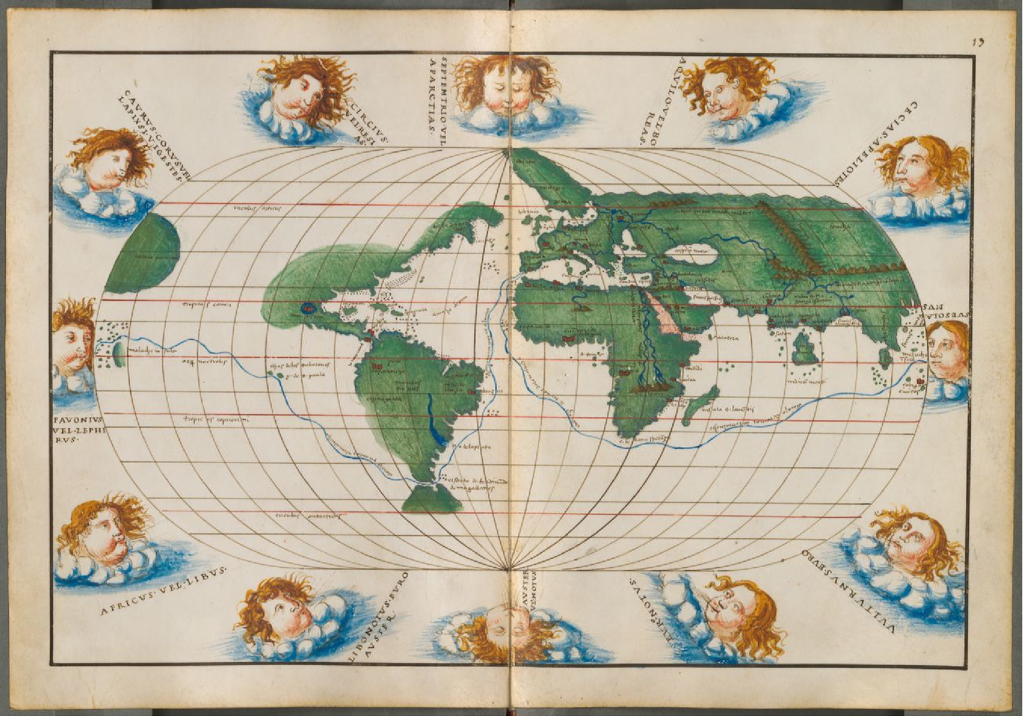
Starting from an image of a 1542 historic map by Battista Agnese (showing the path taken by Magellan and ElCano to circumnavigate the world between 1519 and 1522) I will explore computationally how it compares to the modern day maps. Image processing, geometry, and Geographic Information Systems integration within the Wolfram Language allows for the concise approach.
image=Import["~/WorldAgnese1542.jpg"]
ByteCount[image]
3572120
ImageDimensions[image]
{1304,913}
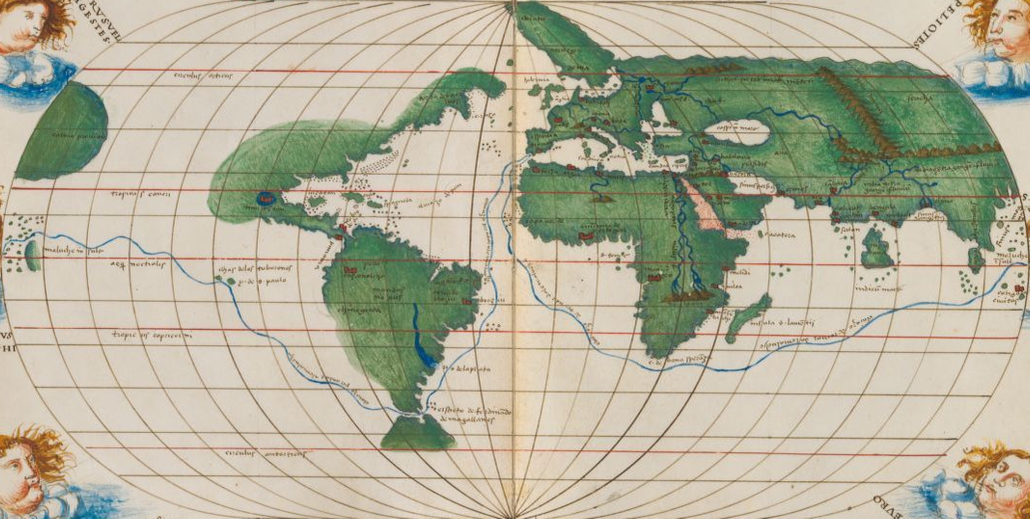
Adjust map borders:
image2=ImageTake[image,{188,725},{119,1185}]
ImageDimensions[image2]
{1067,538}
After some comparisons with our projections, I think “OrteliusOval” is the closest we have. To select the centering, I take the map center to pass just west of West Africa:
lon=-18;
proj={"OrteliusOval","Centering"->{0,lon}};
geogridlines={Table[15i+lon,{i,-6,6}],Table[15i+lon,{i,-12,12}]}
{{-108,-93,-78,-63,-48,-33,-18,-3,12,27,42,57,72},{-198,-183,-168,-153,-138,-123,-108,-93,-78,-63,-48,-33,-18,-3,12,27,42,57,72,87,102,117,132,147,162}}
GeoGraphics[GeoPath[{"Meridian",lon}],GeoRange->{All,{-180,180}+lon},GeoProjection->proj,Frame->True,GeoGridLines->geogridlines]
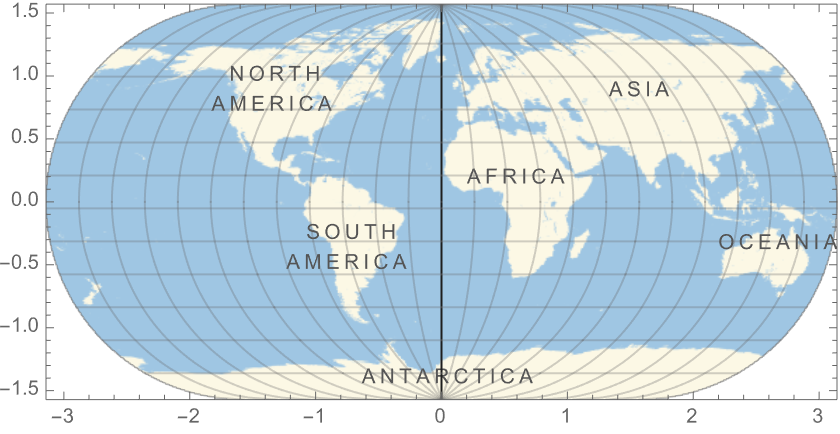
The complete projected range for this projection is {{-Pi, Pi}, {-Pi/2, Pi/2}}:
plotrange=PlotRange/.AbsoluteOptions[%,PlotRange]
{{-3.14159,3.14159},{-1.5708,1.5708}}
This “geo-tags” the image with appropriate projection and projected bounds:
oldmap={GeoStyling[{"Image",image2,"Bounds"->plotrange,"Projection"->proj}],GeoBoundsRegion[{{-90,90},{-180,180}+lon}]};
In what follows we don’t want to show our background tiles:
SetOptions[GeoGraphics,GeoBackground->None];
Check that the graticule of parallels and meridians looks approximately rectangular in an “Equirectangular” projection:
imagesize=1067;
GeoGraphics[oldmap,ImageSize->imagesize]
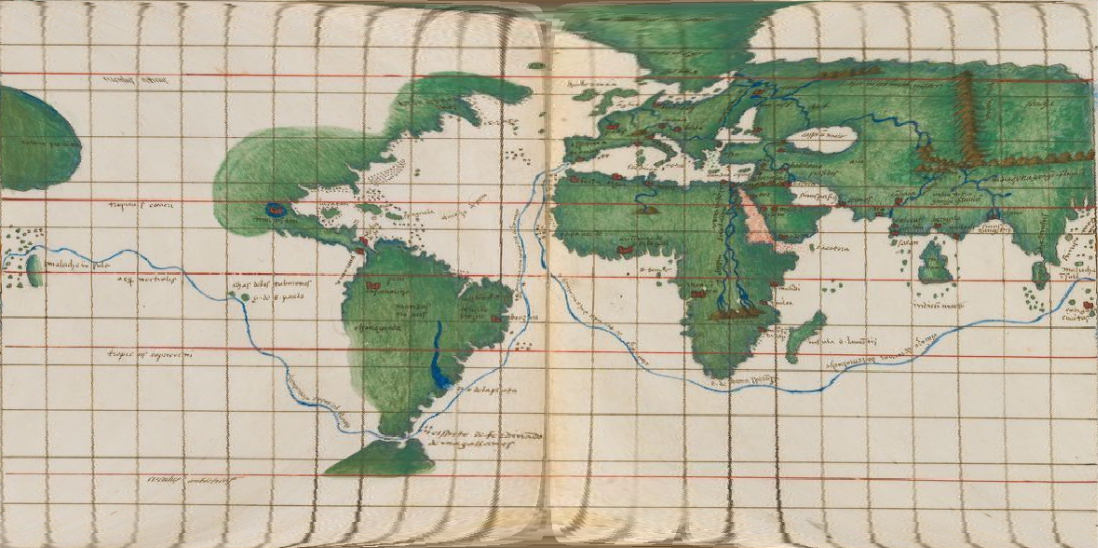
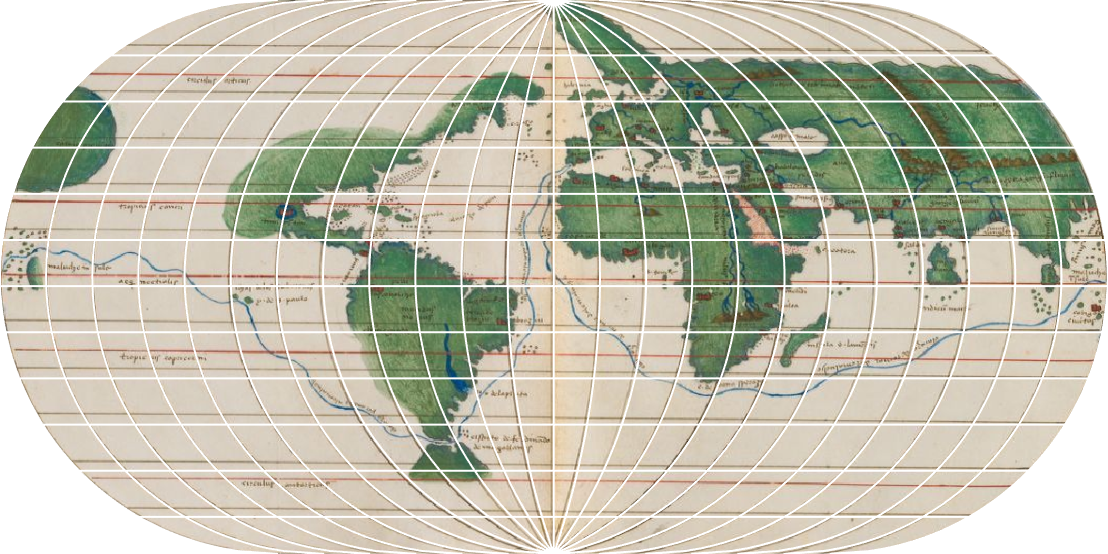
Use the original projection. Note how the meridians coincide well, everywhere. The parallels seem tilted, coinciding better on the RHS than on the LHS of the map:
GeoGraphics[oldmap,GeoProjection->proj,ImageSize->imagesize,GeoGridLines->geogridlines,GeoGridLinesStyle->White]
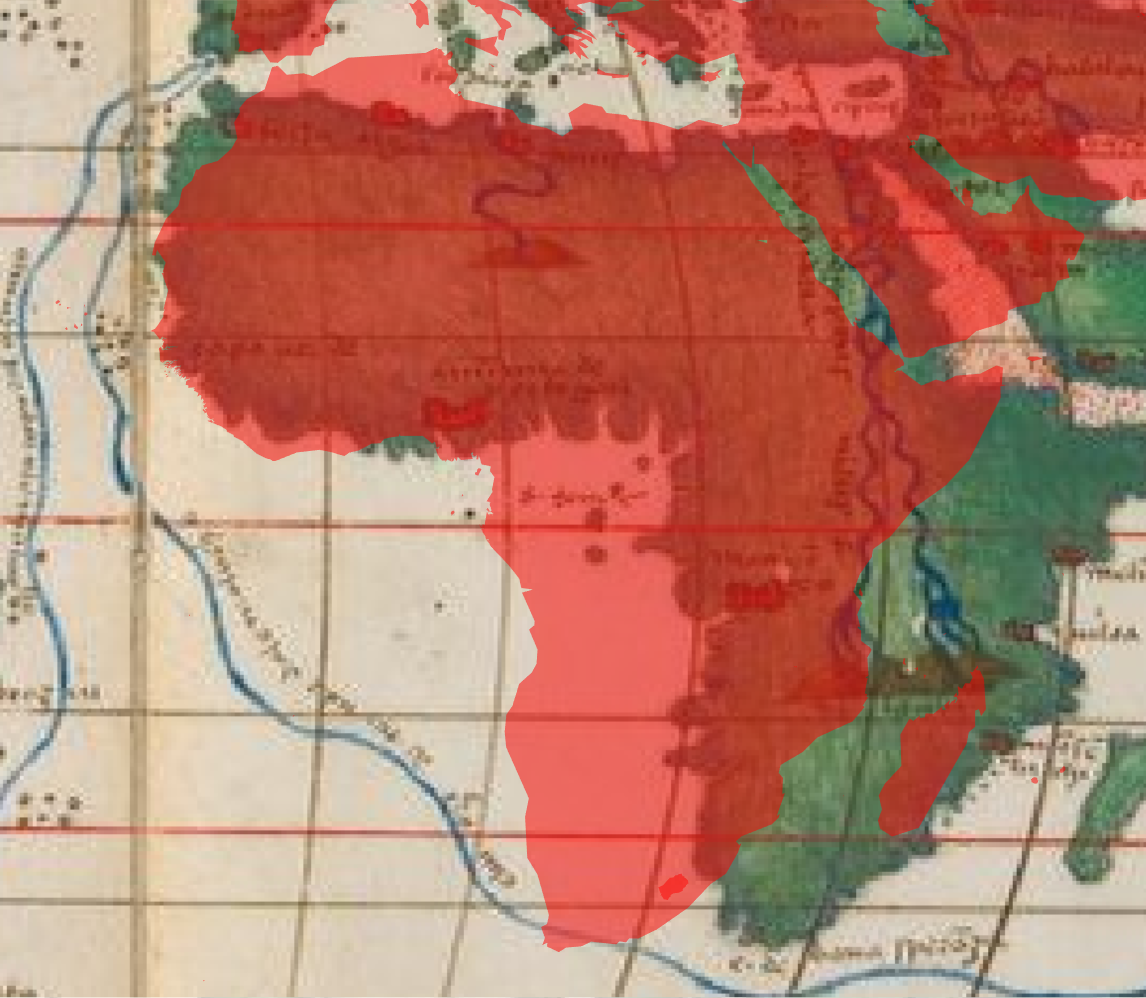
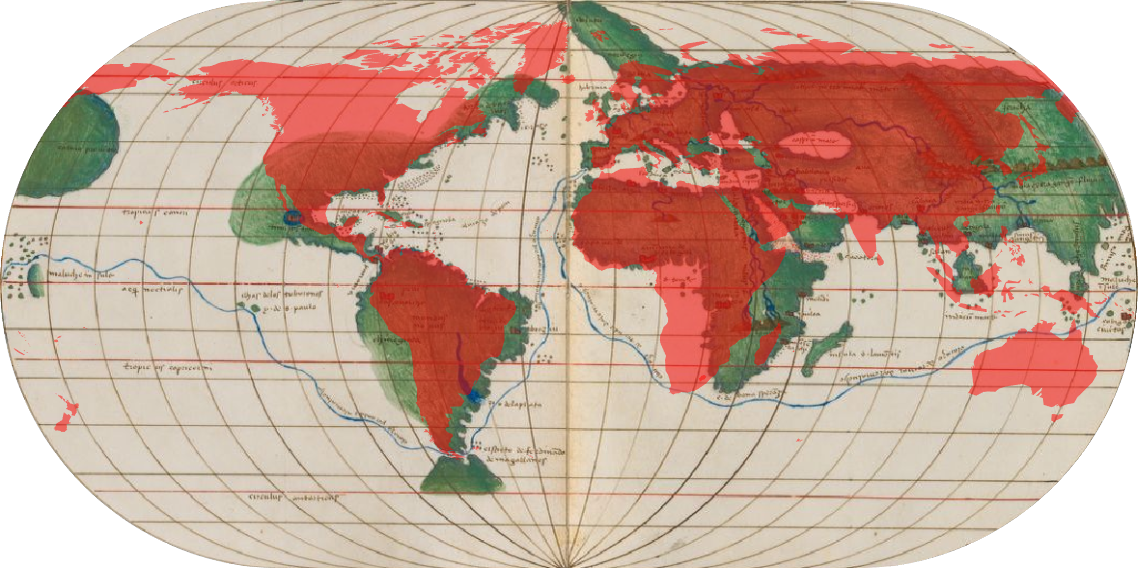
Superimpose a polygon of the world:
world={GeoStyling[Red,Opacity[0.5]],Polygon@GeoVariant[Entity["Country","World"],"SimplifiedArea"]};
GeoGraphics[{oldmap,world},GeoProjection->proj,ImageSize->imagesize]
Show a part of the map:
GeoGraphics{oldmap,GeoStyling[Red,Opacity[0.5]],Polygon@GeoVariant[Entity["Country","World"],"SimplifiedArea"]},GeoRange->,GeoProjection->proj,ImageSize->imagesize