Generate random trees according to particular distributions
by Carlos Alvarez
Student at the Panamericana University, Aguascalientes campus
by Carlos Alvarez
Student at the Panamericana University, Aguascalientes campus
The objective of this project was to implement RandomTree for symbolic tree distributions. Each tree distribution is composed of basic properties such as the total number of nodes, the number of children per node and heights, which can follow fixed values, functions and statistical distributions. Using these three properties gives a lot of variety of combinations that can be used for the construction of random binary trees, ternary trees, complete trees, among others.
The approach uses a general function that receives a description of all the properties that are required and tries to optimize as much as possible. The output of that function is validated through subsequent analysis of trees with considerable size, for example trees with 100,000 nodes. Histograms are currently provided among other plots for a general analysis in addition to the possibility of creating datasets that provide greater numerical and statistical value.
In the basic form, the main algorithm achieves a computational and memory complexity O(Tree Size) dependent on the complexity of the functions that reflect the properties. The tests carried out tend to indicate that it generates sufficiently random trees, although it was not proven how distributed they are generated. Therefore for future improvements of the project it is considered to optimize the generation of trees of height h and apply more rigorously the measurement of the properties of the trees generated.
About Tree Builder and Tree Distribution
About Tree Builder and Tree Distribution
General usage examples
General usage examples
In this section I will give a brief summary of all the functionality of this notebook divided into 3 sections
Tree Generation
Tree Generation
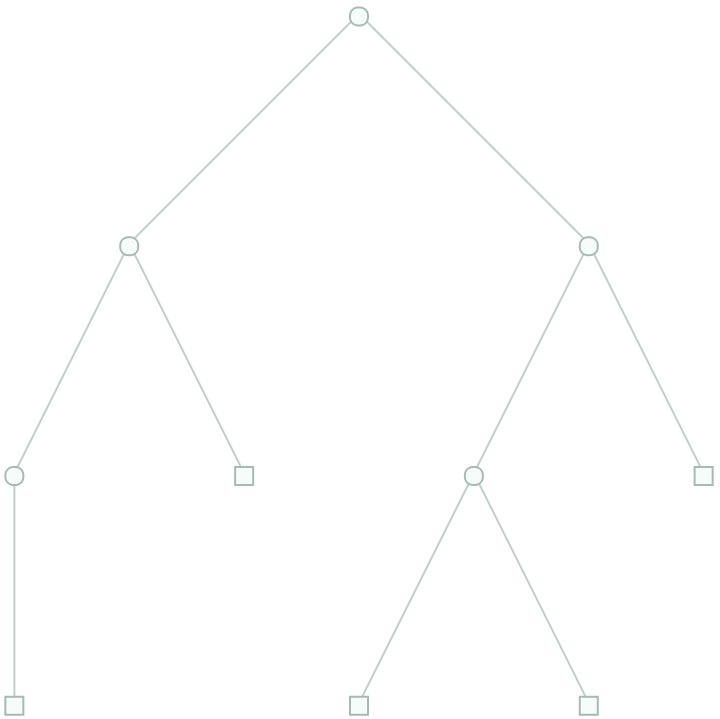
Tree with 10 nodes, 2 children per node and a height of 3
In[]:=
TreeBuilder[TreeDistribution[10,"NodeChildCount"->2,"Height"->3]][[2]]
Out[]=
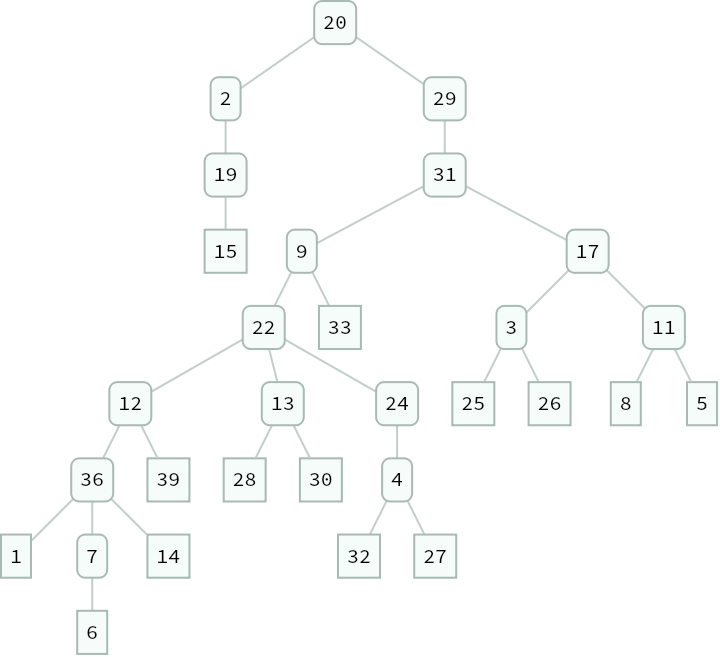
Tree with 40 nodes, 3 children per node and a height of 3 filled with data
In[]:=
TreeBuilder[TreeDistribution[40,"NodeChildCount"->3,"Height"->3,"Data"->RandomSample[Range[40]]]][[2]]
Out[]=

Tree with 30 nodes, NormalDistribution[2,0.5] children per node, height automatic, filled with data
In[]:=
TreeBuilder[TreeDistribution[30,"NodeChildCount"->NormalDistribution[2,0.5],"Data"->RandomSample[Range[40]]]][[2]]
Out[]=
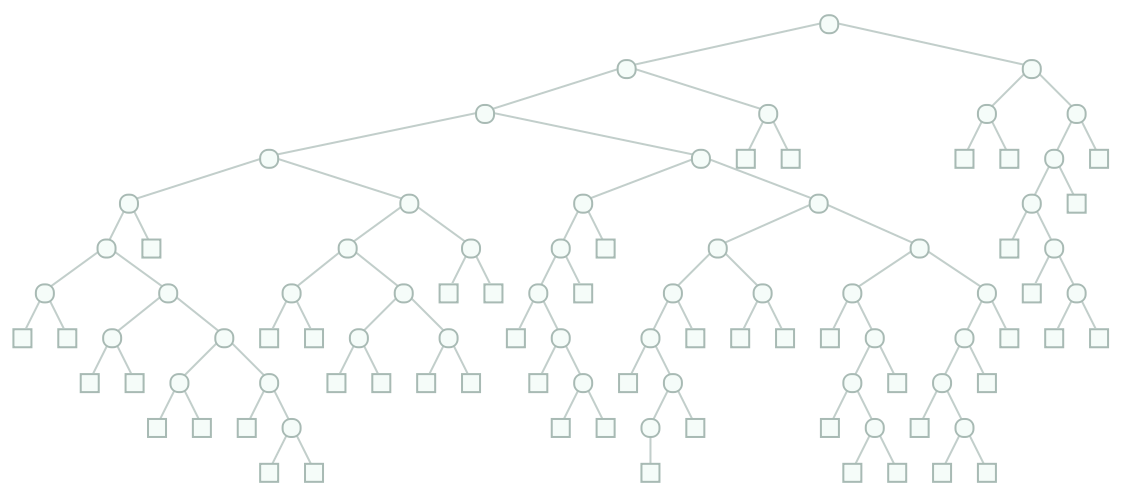
A binary tree of size 100 following the standard design pattern
In[]:=
RandomTree[BinaryTreeDistribution[100]]
Out[]=
Plots
Plots
Tree Dataset
Tree Dataset
Built-in Tree Distributions
Built-in Tree Distributions
The distributions that can be used in the RandomTree[distribution] form are described below.
MaxHeightBSTDistribution
MaxHeightBSTDistribution
Binary Tree Distribution
Binary Tree Distribution
This distribution generates trees where each node will always have 2 children, except that the number of nodes does not allow it.
Examples
Examples
Binary Tree of size 100
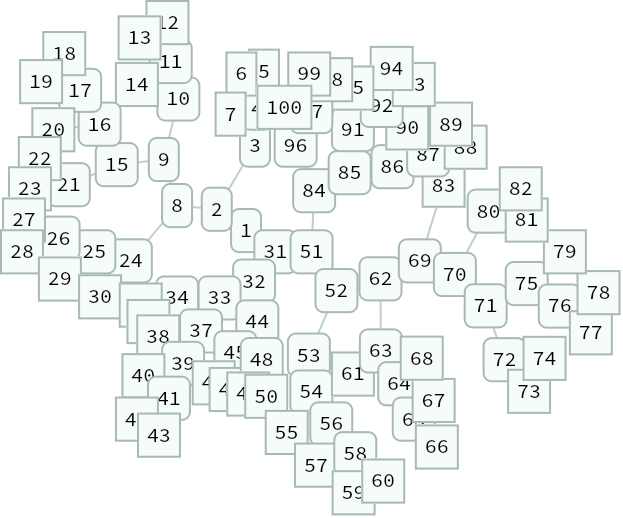
Binary Tree with full options
In[]:=
RandomTree[BinaryTreeDistribution[100,"FillData"->True],TreeLayout"RadialEmbedding"]
Out[]=
Implementation
Implementation
NaryTreeDistribution
NaryTreeDistribution
All Balanced Binary Tree Distribution
All Balanced Binary Tree Distribution
All Balanced Nary Tree Distribution
All Balanced Nary Tree Distribution
Leaves Tree Distribution
Leaves Tree Distribution
Spiral Tree Distribution
Spiral Tree Distribution
This distribution generates n trees, these will be created defined by 3 parameters (Distributions) the number of nodes, the height and the children per node, finally a root will be created and in this all the generated trees will be added.
Examples
Examples
A SpiralTreeDistribution with 10 branches where each branch will have a number of children given by NormalDistribution[25,2], a height given by NormalDistribution[5,1] and a number of children per node NormalDistribution[2,1]
A SpiralTreeDistribution with 4 branches where each branch will have a fixed number of children of 20, a fix height of 4, and a number of children per node of 2
In[]:=
RandomTree[SpiralTreeDistribution[4,20,4,2]]
Out[]=
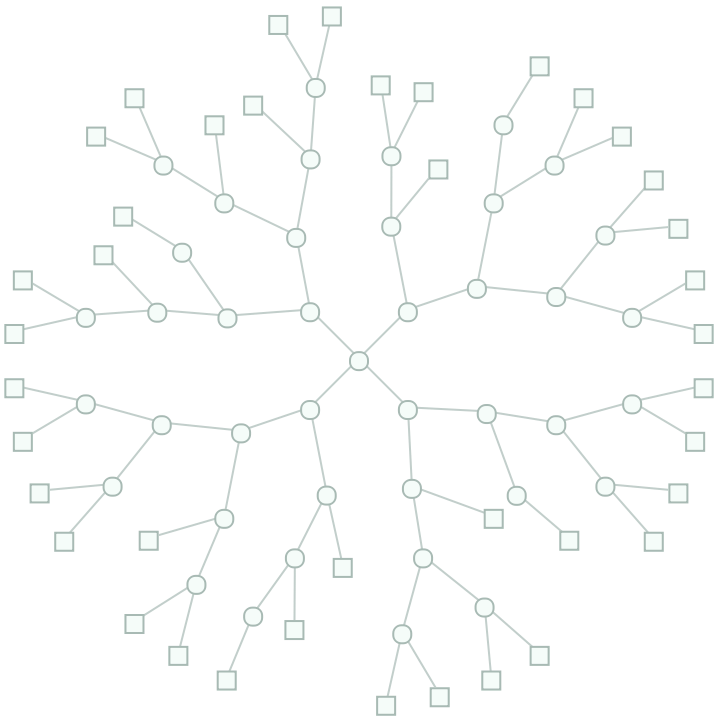
Implementation
Implementation
Child Count Distribution
Child Count Distribution
This distribution generates a tree of size n, and at each node it will try to add a number of children defined by a distribution.
Examples
Examples
Tree with 1000 nodes where each child has a number of children given by a NormalDistribution[2,1]
Tree with 100,000 nodes where each child has a number of children given by a NormalDistribution[8,1]
Implementation
Implementation
Tree Properties
Tree Properties
In this section all the functions that return plots and extract tree information are defined, with some examples given. Some of the main ones are:
Properties Examples
Properties Examples
Generation of trees with more height
Generation of trees with more height
Here the number of children is fixed, but the distribution to place them is that of Poisson, adjusted so that it returns values that point to the last nodes added, in this way trees with more height are obtained.
Poisson multiplier: With this the height of the tree can be varied.
Poisson multiplier: With this the height of the tree can be varied.
Generation of trees with more width
Generation of trees with more width
Width mean defines target positions where new nodes should be added. The lower, the wider the tree will be, therefore less tall.
Width Variance defines how spread out the target aggregations will be. Taller means a greater variety of trees.
N: Amount of Nodes
Width Variance defines how spread out the target aggregations will be. Taller means a greater variety of trees.
N: Amount of Nodes
Concluding remarks
Concluding remarks
What allows to generate different types of trees is LinkerPositionF, which specifies pivots for the creation of the tree, briefly describing its operation, if it is used favoring certain positions such as the final ones, it tends to generate very little branched trees with great heights, instead if there is a tendency to choose initial positions, trees with less height and more leaves are created, therefore the default algorithm uses a uniform distribution to choose the positions, in this way it is avoided that it becomes very tall or very little branched, however still with this, the position favoring effect continues to affect, since the new nodes added will generate subtrees with greater probabilities of being chosen, which causes general imbalances, making the only way to eliminate this effect the use of a normal distribution whose mean is between 0.2 and 0.5 and with a variance between 0.2 and 0.3, to nullify the effect, however this is merely empirical and does more analysis is needed for a more concrete and accurate answer.
Even with the different ways of visualizing the data, from graphs, histograms and datasets, all the information they provide us is obtained in numerical statistical form, so for greater rigor and usability, mathematical formulas could be developed that define, for example, given a specific distribution of trees, what will be the average number of balanced trees, their size, height. Another possible development is what kind of N-ary tree tends to be generated with a certain height and number of nodes.
There are many things to improve and develop but I consider that the project fulfilled its initial objective, in addition to presenting different examples that make it easier to monitor the project.
Keywords
Keywords
◼
Random Tree
◼
Binary Tree Distribution
◼
Child Count Tree Distribution
◼
Height Tree Distribution
◼
Tree Histogram
◼
Tree Distribution
◼
Tree Dataset
Acknowledgment
Acknowledgment
I thank the entire team that made this summer school possible, they were very fun and pleasant days as well as challenging, the presentations, materials and attention were also very good, also I would like to especially thank Connor Gray, my mentor, for helping me with my doubts and advising me during school, Stephen Wolfram for defining my project and Mads Bahrami who conducted my summer school interview and also answered my questions.
References
References