3.2 Generate 3 D contour plot of the total velocity on multiple slices.
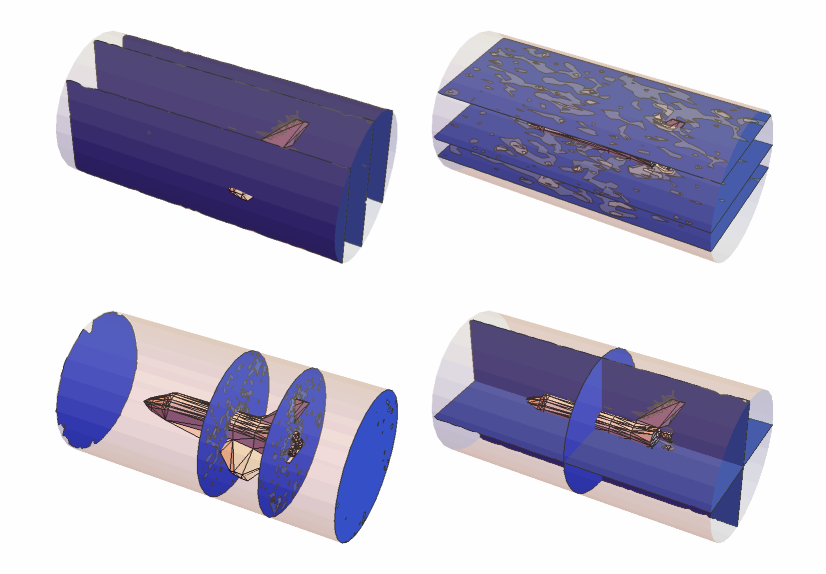
3.2 Generate 3 D contour plot of the total velocity on multiple slices.
The following visualizations show the total velocity magnitude of generating 3D contour plot on multiple slices .
V(t,x,y,z)=++
2
u(t,x,y,z)
2
v(t,x,y,z)
2
w(t,x,y,z)
In[]:=
ListAnimate[Table[GraphicsColumn[{GraphicsRow[{Show[bmesh["Wireframe"["MeshElementStyle"Directive[FaceForm[Opacity[0.25]],EdgeForm[]]]],Graphics3D[{Opacity[1],dg}],SliceContourPlot3D[Evaluate[Sqrt[xVel[t,x,y,z]^2+yVel[t,x,y,z]^2+zVel[t,x,y,z]^2]],{"YStackedPlanes",{-4,0,4}},{x,y,z}∈mesh,AspectRatioAutomatic,ColorFunction"TemperatureMap",PlotRange->All]],Show[bmesh["Wireframe"["MeshElementStyle"Directive[FaceForm[Opacity[0.25]],EdgeForm[]]]],Graphics3D[{Opacity[1],dg}],SliceContourPlot3D[Evaluate[Sqrt[xVel[t,x,y,z]^2+yVel[t,x,y,z]^2+zVel[t,x,y,z]^2]],{"ZStackedPlanes",{-2,0,3.6}},{x,y,z}∈mesh,AspectRatioAutomatic,ColorFunction"TemperatureMap",PlotRange->All]]}],GraphicsRow[{Show[bmesh["Wireframe"["MeshElementStyle"Directive[FaceForm[Opacity[0.25]],EdgeForm[]]]],Graphics3D[{Opacity[1],dg}],SliceContourPlot3D[Evaluate[Sqrt[xVel[t,x,y,z]^2+yVel[t,x,y,z]^2+zVel[t,x,y,z]^2]],{"XStackedPlanes",{-12,0.8,5.9,12}},{x,y,z}∈mesh,AspectRatioAutomatic,ColorFunction"TemperatureMap",PlotRange->All]],Show[bmesh["Wireframe"["MeshElementStyle"Directive[FaceForm[Opacity[0.25]],EdgeForm[]]]],Graphics3D[{Opacity[1],dg}],SliceContourPlot3D[Evaluate[Sqrt[xVel[t,x,y,z]^2+yVel[t,x,y,z]^2+zVel[t,x,y,z]^2]],"CenterPlanes",{x,y,z}∈mesh,AspectRatioAutomatic,ColorFunction"TemperatureMap",PlotRange->All]]}]}],{t,0,1.05,0.105}],1]
(Because the file is too large to upload, so the animation output results for screenshots. )
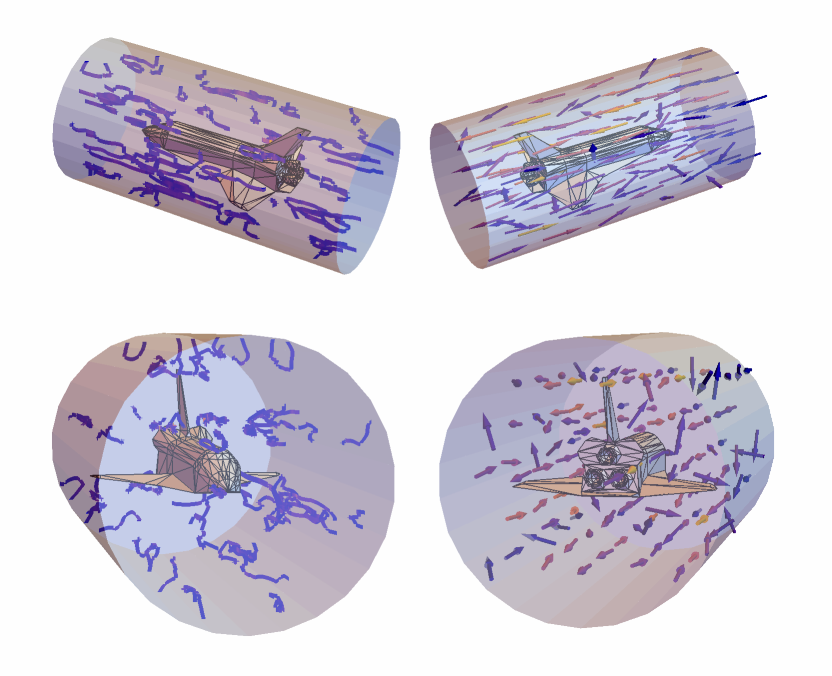
3.3 3D Stream plot and 3D vector plot of the velocity field.
3.3 3D Stream plot and 3D vector plot of the velocity field.
The following visualizations show a 3D stream plot and 3D vector plot of the velocity field .
V(t,x,y,z)={u(t,x,y,z),v(t,x,y,z),w(t,x,y,z)}
In[]:=
ListAnimate[Table[GraphicsColumn[{GraphicsRow[{Show[bmesh["Wireframe"["MeshElementStyle"Directive[FaceForm[Opacity[0.25]],EdgeForm[]]]],Graphics3D[{Opacity[1],dg}],StreamPlot3D[{xVel[t,x,y,z],yVel[t,x,y,z],zVel[t,x,y,z]},{x,y,z}∈mesh],MeshNone,ViewPoint{1.3,-2.4,2.}],Show[bmesh["Wireframe"["MeshElementStyle"Directive[FaceForm[Opacity[0.25]],EdgeForm[]]]],Graphics3D[{Opacity[1],dg}],VectorPlot3D[{xVel[t,x,y,z],yVel[t,x,y,z],zVel[t,x,y,z]},{x,y,z}∈mesh],MeshNone,ViewPoint{1.3,2.4,2.}]}],GraphicsRow[{Show[bmesh["Wireframe"["MeshElementStyle"Directive[FaceForm[Opacity[0.25]],EdgeForm[]]]],Graphics3D[{Opacity[1],dg}],StreamPlot3D[{xVel[t,x,y,z],yVel[t,x,y,z],zVel[t,x,y,z]},{x,y,z}∈mesh],MeshNone,ViewPoint{-3,0.5,0.25}],Show[bmesh["Wireframe"["MeshElementStyle"Directive[FaceForm[Opacity[0.25]],EdgeForm[]]]],Graphics3D[{Opacity[1],dg}],VectorPlot3D[{xVel[t,x,y,z],yVel[t,x,y,z],zVel[t,x,y,z]},{x,y,z}∈mesh],MeshNone,ViewPoint{3,0.5,0.25}]}]}],{t,0,1.05,0.105}],1]
(Because the file is too large to upload, so the animation output results for screenshots. )