A data set on the prevalence of infection for an outbreak lasting 200 days in a population of 500 people is given, as shown in the table below .
In[]:=
Clear["Global`*"]
data={{10,19},{17,4},{24,5},{32,47},{36,38},{38,54},{41,84},{42,55},{47,116},{50,102},{52,126},{58,153},{59,164},{62,172},{63,177},{67,142},{68,158},{69,151},{75,155},{80,125},{81,116},{84,101},{87,106},{88,116},{94,85},{98,59},{102,67},{105,57},{114,59},{117,24},{118,39},{120,31},{128,36},{134,8},{140,7},{142,3},{147,20},{150,7},{155,2},{159,25},{163,2},{186,10},{191,17},{200,7}};dataTable=TableForm[data,TableHeadings->{None,{"Time","Number Infected"}}]
Out[]//TableForm=
Time | Number Infected |
10 | 19 |
17 | 4 |
24 | 5 |
32 | 47 |
36 | 38 |
38 | 54 |
41 | 84 |
42 | 55 |
47 | 116 |
50 | 102 |
52 | 126 |
58 | 153 |
59 | 164 |
62 | 172 |
63 | 177 |
67 | 142 |
68 | 158 |
69 | 151 |
75 | 155 |
80 | 125 |
81 | 116 |
84 | 101 |
87 | 106 |
88 | 116 |
94 | 85 |
98 | 59 |
102 | 67 |
105 | 57 |
114 | 59 |
117 | 24 |
118 | 39 |
120 | 31 |
128 | 36 |
134 | 8 |
140 | 7 |
142 | 3 |
147 | 20 |
150 | 7 |
155 | 2 |
159 | 25 |
163 | 2 |
186 | 10 |
191 | 17 |
200 | 7 |
pointsPlot=ListPlot[data,PlotStyle->PointSize[Medium],Frame->True,FrameLabel->{"Time (days)","Number Infected"},GridLines->Automatic,GridLinesStyle->LightGray,PlotRange->{{0,210},{-5,350}},BaseStyle->{FontSize->14},ImageSize->400]
Out[]=
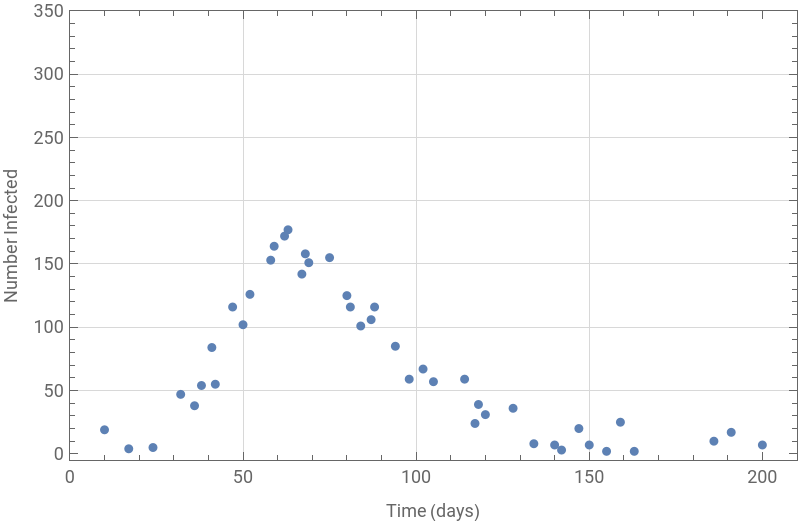
Plotting the dataset, this look like an epidemic curve for an outbreak starting with the introduction of one infected case . We have data points of the prevalence of infection spanning the entire duration of the epidemic (200 days), but not for every day . Define the simple SIR model and model input:
What are the best - fitting values for β and γ?
What are the best - fitting values for and ?
β
γ
In[]:=
(*totalsizeofpopulation*)n=500;
In[]:=
times=data[[All,1]]
Out[]=
{10,17,24,32,36,38,41,42,47,50,52,58,59,62,63,67,68,69,75,80,81,84,87,88,94,98,102,105,114,117,118,120,128,134,140,142,147,150,155,159,163,186,191,200}
In[]:=
(*Fludataset*)numberinfected=data[[All,2]]
Out[]=
{19,4,5,47,38,54,84,55,116,102,126,153,164,172,177,142,158,151,155,125,116,101,106,116,85,59,67,57,59,24,39,31,36,8,7,3,20,7,2,25,2,10,17,7}
In[]:=
ClearAll[β,γ]sireqns={s'[t]==-β*s[t]*i[t]/n,i'[t]==β*s[t]*i[t]/n-γ*i[t],r'[t]==γ*i[t]};initialConditions={s[0]==n,i[0]==1,r[0]==0};
In[]:=
sol=ParametricNDSolve[{sireqns,initialConditions},{s,i,r},{t,0,times},{β,γ}];
In[]:=
(*Extracttheinfectedvaluesfromthesolution*)infectedValues=i/.sol;
objective[b_,g_]:=Norm[(infectedValues[b,g][times]-numberinfected)]^2bDom=Range[0,2,0.01];gDom=Range[0,1,0.01];res=Flatten[Table[{b,g,objective[b,g]},{b,bDom},{g,gDom}],1];Flatten[res[[PositionSmallest[res[[All,3]]]]]]//Most
Out[]=
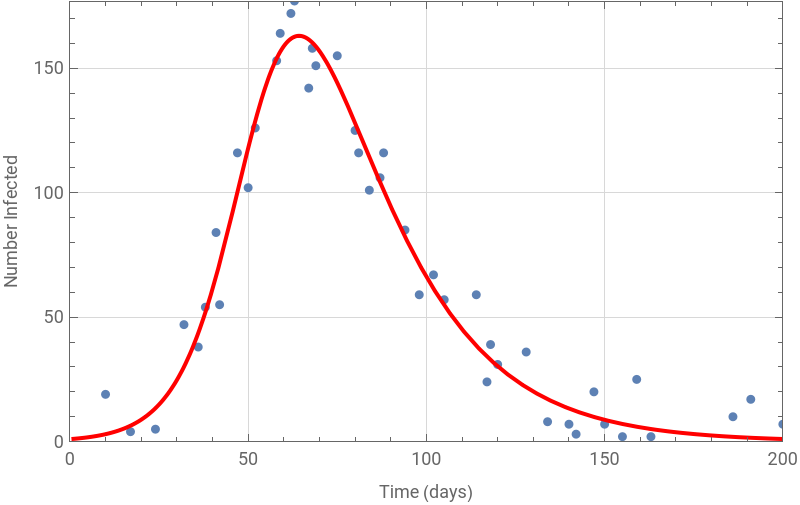
{0.16,0.05}
We can confirm visually that this parameter set produces a good model fit to the data, by overlaying the datapoints on a plot of the model output:
(*Setparametervalues*){β,γ}={0.16,0.05};(*DefinetheSIRmodelequations*)sireqns={s'[t]==-β*s[t]*i[t]/n,i'[t]==β*s[t]*i[t]/n-γ*i[t],r'[t]==γ*i[t]};initialConditions={s[0]==n,i[0]==1,r[0]==0};
(*Solvethedifferentialequations*)sol=NDSolve[{sireqns,initialConditions},{s,i,r},{t,0,times}];
In[]:=
(*Extracttheinfectedvaluesfromthesolution*)infectedValues=i/.sol[[1]];
In[]:=
(*Calculatethesum-of-squares(SSQ)value*)ssq=Norm[infectedValues[Range[times]]-numberinfected]^2;

fitPlot=Plot[infectedValues[t],{t,1,200},PlotStyle->Red];Show[pointsPlot,fitPlot,PlotRange->All]
Out[]=
Based on our estimates parameter values, what would be the critical vaccination threshold required to prevent this epidemic, assuming an all - or - nothing vaccine with 75 % efficacy?
We can calculate the critical effective vaccination coverage as :1-1-1-0.69
p
eff
1
R
0
1
β
γ
0.05
0.16
Since the all - or - nothing vaccine is only 75 % effective, we can calculate the critical vaccination threshold as :
p
c
p
eff
v
eff
0.69
0.75
To interrupt transmission and bring <1, 92 % of the population would have to be vaccinated . We can confirm the absence of an epidemic under these conditions using the simulation code :
R
0
In[]:=
(*only8%ofthepopulationaresusceptible,92%ofthepopulationarevaccinated/immune*)initialConditionsvac={s[0]==499*0.08,i[0]==1,r[0]==499*0.92};
sol1=NDSolve[{sireqns,initialConditionsvac},{s,i,r},{t,0,200}];
CITE THIS NOTEBOOK
CITE THIS NOTEBOOK
Optimizing transmission & recovery parameters to fit flu infection data in a calibrated SIR model
by Athanasios Paraskevopoulos
Wolfram Community, STAFF PICKS, August 29, 2023
https://community.wolfram.com/groups/-/m/t/3000833
by Athanasios Paraskevopoulos
Wolfram Community, STAFF PICKS, August 29, 2023
https://community.wolfram.com/groups/-/m/t/3000833