Rotation-Vibration Energy Level Transitions of a Diatomic Rotor
Rotation-Vibration Energy Level Transitions of a Diatomic Rotor


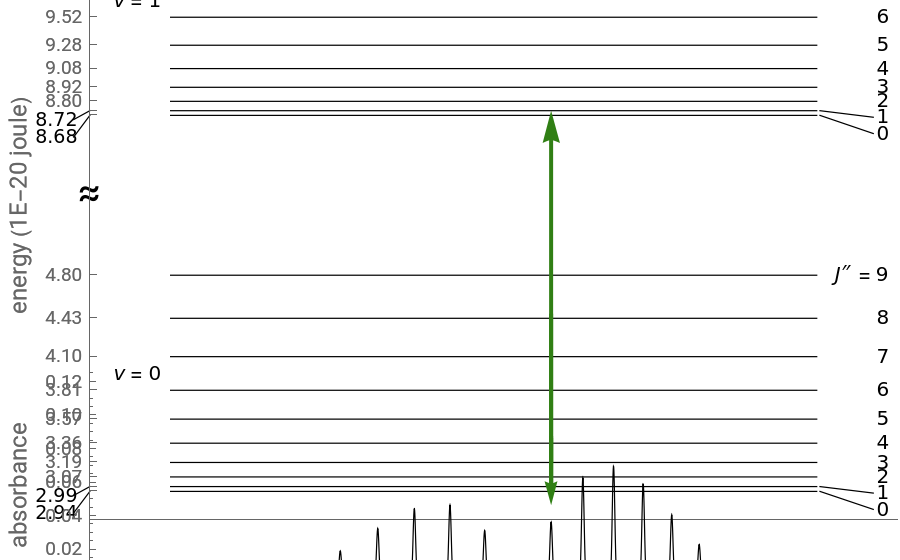
This Demonstration shows the energy level transitions associated with each line observed in a rotationally resolved infrared band spectrum, in which the ← vibrational transition is coupled with ← rotational transitions. For a diatomic molecule the vibrational and rotational energy levels are quantized and the selection rules are (vibration) and (rotation). Only transitions that meet the selection rule requirements are allowed, and as a result discrete spectral lines are observed, as shown in the bottom graphic. The position of a spectral line corresponds to the energy difference between the initial and final states of the transition. These energy level transitions from the ground to excited rotation-vibration states are shown in the top graphic. The spectrum consists of a branch (, , smaller wavenumbers, lower energy transitions) and an branch (, , larger wavenumbers, higher energy transitions). The central gap between the and branches represents the forbidden branch since the selection rule makes the transitions forbidden. A branch can appear, however, if the molecule has electronic angular momentum, a well-known case being the NO molecule.
v
1
v
0
′
J
″
J
Δv=±1
ΔJ=±1
P
Δv=+1
ΔJ=-1
R
Δv=+1
ΔJ=+1
P
R
Q
ΔJ
ΔJ=0
Q
Details
Details
This Demonstration utilizes molecular constants of the molecule and the infrared spectrum is simulated at a temperature of 200 Kelvin.
35
HCl
35
HCl
ω
e
-1
cm
ω
e
χ
e
-1
cm
B
e
-1
cm
α
e
-1
cm
D
e
-1
cm
The intensity of the observed spectral lines reflects the dependence on the thermal population of the initial rotational energy levels and the dependence on the quantum number , not on the magnitude of the corresponding transition energy.
J
Note: the axis on the energy level diagram (top graphic) is arbitrary. The arrows indicating transitions in the top graphic are spread out for clarity and so that their positioning lies directly above the corresponding transition wavenumber in the spectrum below (bottom graphic).
x
References
References
[1] P. Atkins and J. de Paula, Physical Chemistry, New York: Oxford University Press, 2006.
[2] G. Herzberg, Molecular Spectra and Molecular Structure I. Spectra of Diatomic Molecules, Princeton, New Jersey: D. Van Nostrand Company, Inc., 1950.
[3] K. P. Huber and G. Herzberg, Molecular Spectra and Molecular Structure IV. Constants of Diatomic Molecules, New York: Van Nostrand Reinhold Company, 1979.
[4] Diatomic Constants for HCl. webbook.nist.gov/cgi/cbook.cgi?ID=C7647010&Units=SI&Mask=1000# Diatomic (NIST Chemistry WebBook. webbook.nist.gov/chemistry).
External Links
External Links
Permanent Citation
Permanent Citation
Whitney R. Hess, Lisa M. Goss
"Rotation-Vibration Energy Level Transitions of a Diatomic Rotor"
http://demonstrations.wolfram.com/RotationVibrationEnergyLevelTransitionsOfADiatomicRotor/
Wolfram Demonstrations Project
Published: March 7, 2011