General and COVID-19 deaths in Sweden
Oscar Rodriguez, Corporación Universitaria Iberoamericana
Oscar Rodriguez, Corporación Universitaria Iberoamericana
In this notebook i am trying to uncover if the sar-cov-2 is having a major impact in deceases in Swedish. I am using the same database previously used by Jan Brugard (https://community.wolfram.com/groups/-/m/t/1974412).
Death by day
Death by day
First, i would like to see how the deceased are distributed since 2015. I am excluding the day with zero deaths
deathByDay=Import[FileNameJoin[{NotebookDirectory[],"2020-05-08---preliminar-statistik-over-doda-inkl-eng.xlsx"}],{"XLSX","Data",2}];(*NumberofdeathsreportedtoStatisticsSweden,perdayfor2015-20201(entirecountry)*)
TableForm[deathByDay,TableHeadingsAutomatic];
of2015=DeleteCases[deathByDay[[8;;,2]],0.`];(*seborranlosregistrosconcero,yaqueelinteressonelconteodelosfallecidos*)
of2016=DeleteCases[deathByDay[[8;;,3]],0.`];
of2017=DeleteCases[deathByDay[[8;;,4]],0.`];
of2018=DeleteCases[deathByDay[[8;;,5]],0.`];
of2019=DeleteCases[deathByDay[[8;;,6]],0.`];
of2020=DeleteCases[deathByDay[[8;;,7]],0.`];
ofAverage=deathByDay[[8;;,8]];
DistributionChart[{of2015,of2016,of2017,of2018,of2019,of2020,ofAverage},ChartElementFunctionChartElementData["PointDensity"],ChartLabels{"2015","2016","2017","2018","2019","2020","Average"},PlotLabel"Number of deaths reported to Statistics Sweden,per day for 2015-20201 (entire country)",ChartStyle"SouthwestColors",BaseStyle14,ImageSize800,ScalingFunctions"Log",FrameLabel{"Year","# of death"}]
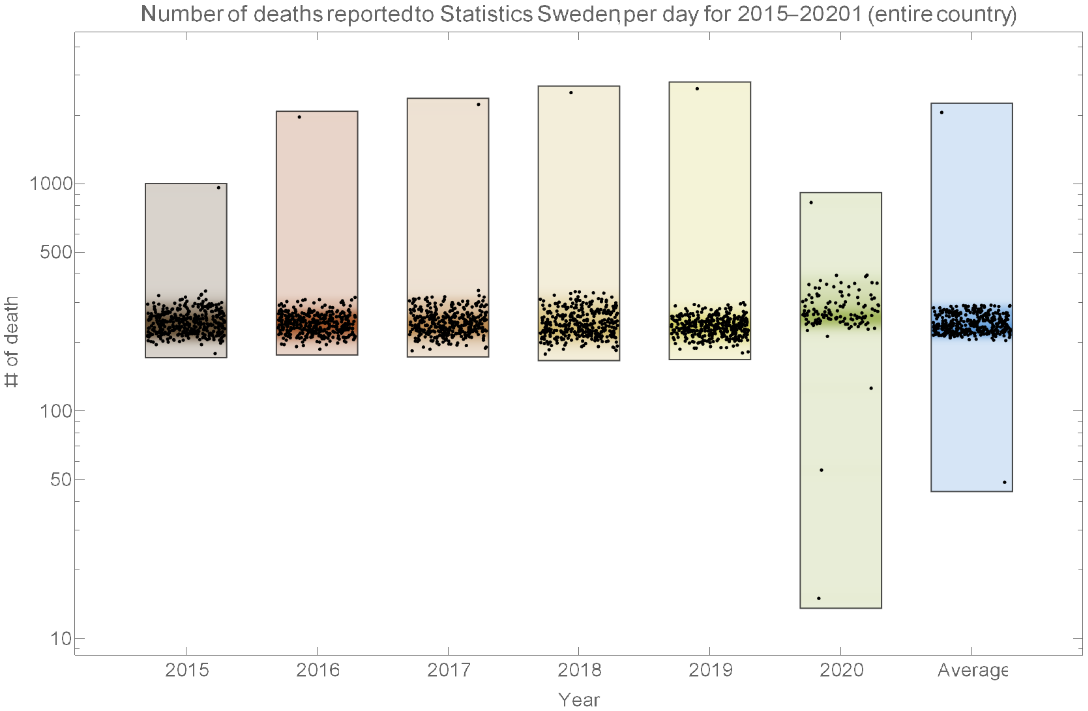
This graph shows the distribution of the death count from 2015 to 2020. In all cases, there is a very marked distribution of deaths, with some peaks in all years except 2020. This is because all the data is not available. in 2020, only until May 6. In 2020 there is a more dispersed trend.
Este gráfico muestra la distribución del conteo de muertes desde al año 2015 al 2020. En todos los casos se ve una distribución de las muertes muy marcado, con algunos picos en todos los años excepto en 2020. Esto debido a que no están todos los datos en 2020, solo hasta mayo 6. En 2020 se ve una tendencia más dispersa.
Este gráfico muestra la distribución del conteo de muertes desde al año 2015 al 2020. En todos los casos se ve una distribución de las muertes muy marcado, con algunos picos en todos los años excepto en 2020. Esto debido a que no están todos los datos en 2020, solo hasta mayo 6. En 2020 se ve una tendencia más dispersa.
DistributionChart[{of2019,of2020},ChartLayout"Overlapped",ChartBaseStyleOpacity[0.3],ChartLegends{"otro","2020"},PlotLabel"Number of deaths reported to Statistics Sweden,per day for 2015-20201 (entire country)",ChartStyle"SouthwestColors",BaseStyle14,ImageSize800,FrameLabel{"Year","# of death"}]
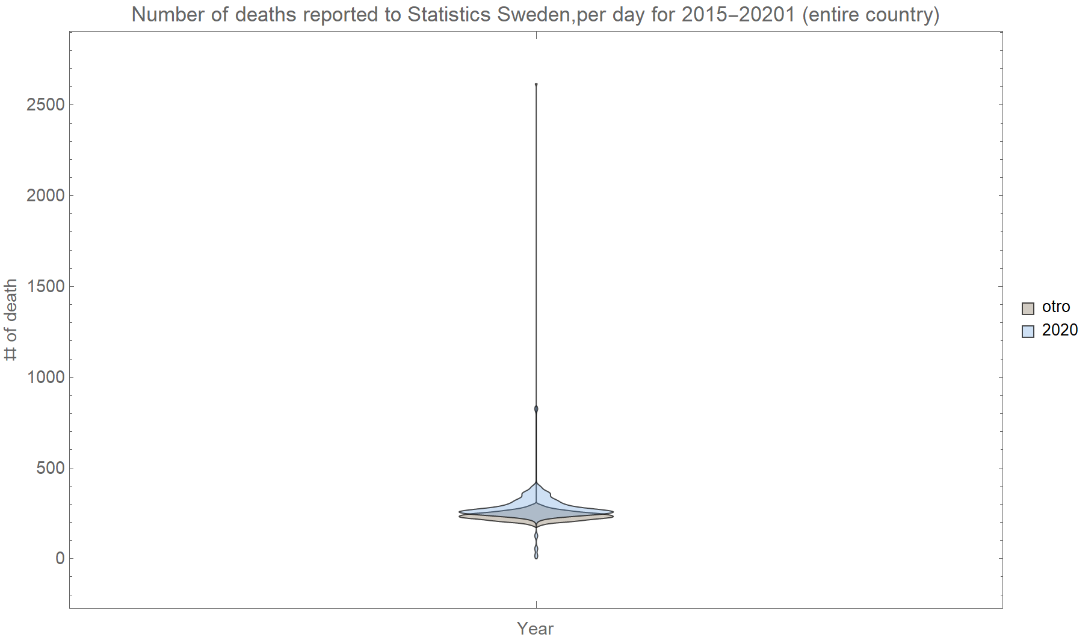
Now, this is showing the whole year, except for 2020. So this is how it looks if we show the deceased until may 6 every year.
LocationEquivalenceTest[{Standardize[of2015May6],Standardize[of2020May6]}]
0.469462
of2015May6=DeleteCases[deathByDay[[8;;134,2]],0.`];(*seborranlosregistrosconcero,yaqueelinteressonelconteodelosfallecidos*)
of2016May6=DeleteCases[deathByDay[[8;;134,3]],0.`];
of2017May6=DeleteCases[deathByDay[[8;;134,4]],0.`];
of2018May6=DeleteCases[deathByDay[[8;;134,5]],0.`];
of2019May6=DeleteCases[deathByDay[[8;;134,6]],0.`];
of2020May6=DeleteCases[deathByDay[[8;;134,7]],0.`];
ofAverageMay6=deathByDay[[8;;134,8]];
DistributionChart[{of2015May6,of2016May6,of2017May6,of2018May6,of2019May6,of2020May6,ofAverageMay6},ChartElementFunctionChartElementData["PointDensity"],ChartLabels{"2015","2016","2017","2018","2019","2020","Average"},PlotLabel"Number of deaths reported to Statistics Sweden,per day for 2015-20201 (entire country) until may 6",ChartStyle"SouthwestColors",BaseStyle14,ScalingFunctions"Log",ImageSize900,FrameLabel{"Year","# of death"}]
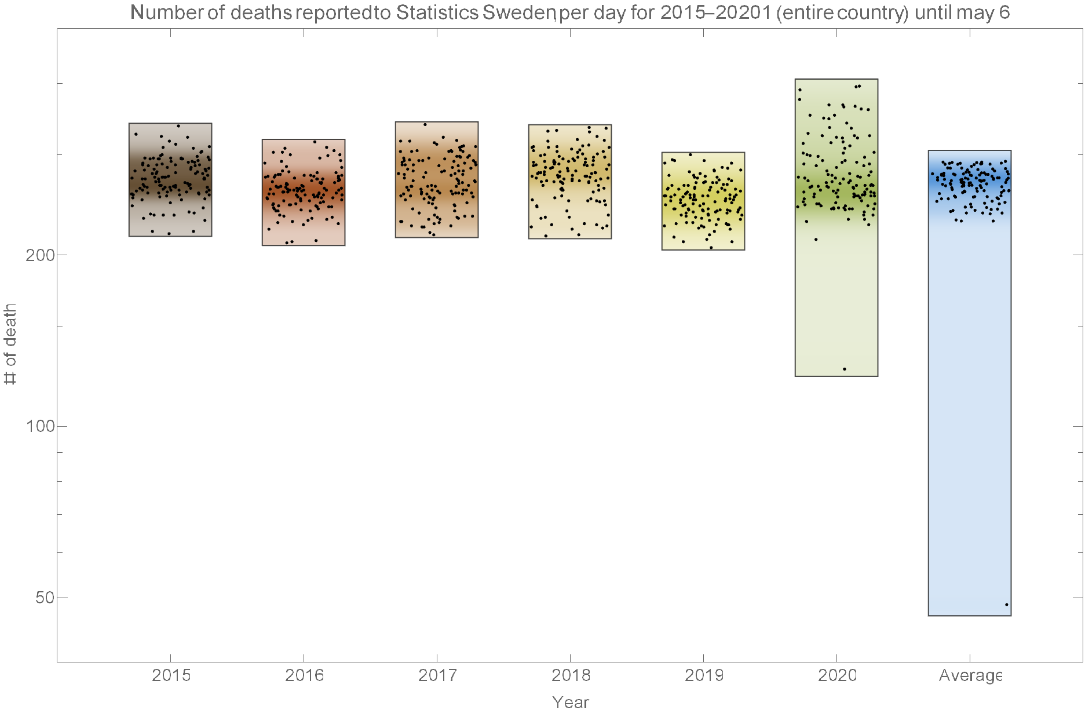
This graph shows the distribution of deaths until May 6, in this case the peaks of deaths are not evident in all the years prior to 2020.
Esta gráfica muestra la distribución de las muertes hasta mayo 6, en este caso no se evidencian los picos de muertes en todos los años previos al 2020.
Esta gráfica muestra la distribución de las muertes hasta mayo 6, en este caso no se evidencian los picos de muertes en todos los años previos al 2020.
probabli=SmoothHistogram[{of2015May6,of2016May6,of2017May6,of2018May6,of2019May6,of2020May6},PlotRangeAll,PlotLegends{"2015","2016","2017","2018","2019","2020","Average"},PlotLabel"Death distribution 2015-2020 until may 6",PlotTheme"Web"];
LocationEquivalenceTest[{of2015May6,of2016May6,of2017May6,of2018May6,of2019May6,of2020May6},{{"TestDataTable",All},"TestConclusion"}]

,The null hypothesis that the mean are equal is rejected at the 5 percent level based on the Kruskal-Wallis test.
Statistic | P-Value | |
Kruskal-Wallis | 93.3267 | 8.0296× -20 10 |
cumula=SmoothHistogram[{of2015May6,of2016May6,of2017May6,of2018May6,of2019May6,of2020May6},Automatic,"CDF",PlotRangeAll,PlotLegends{"2015","2016","2017","2018","2019","2020"},PlotLabel"Death distribution 2015-2020 until may 6, cumulative",PlotTheme"Web"];
survi=SmoothHistogram[{of2015May6,of2016May6,of2017May6,of2018May6,of2019May6,of2020May6},Automatic,"SF",PlotRangeAll,PlotLegends{"2015","2016","2017","2018","2019","2020"},PlotLabel"Death distribution 2015-2020 until may 6, survival",PlotTheme"Web"];
Grid[{{probabli},{cumula},{survi}},ItemSize50]
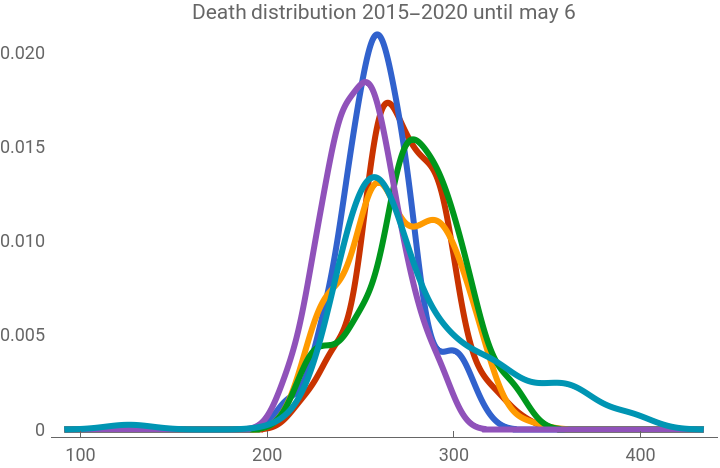


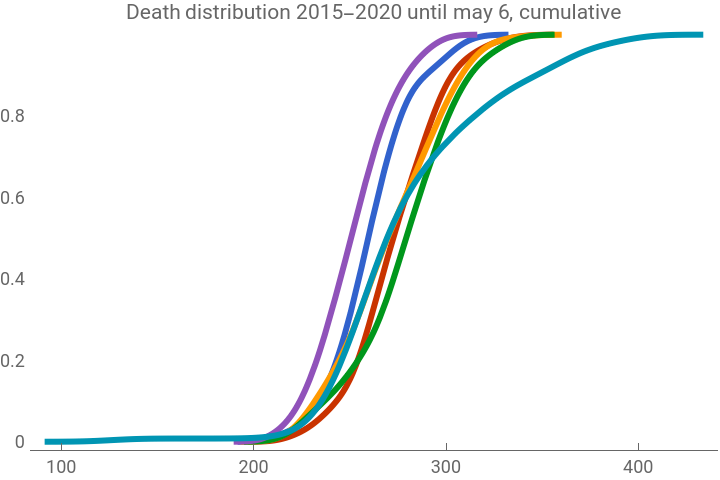
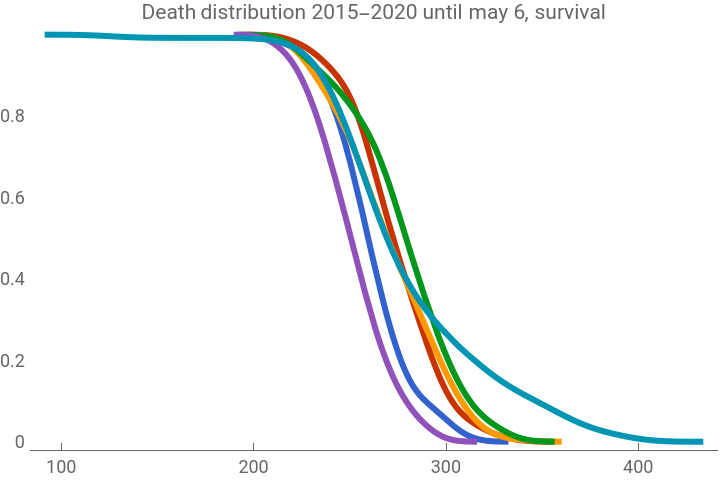
The distributions between the different years do not differ much. However, when generating an inferential statistical test, it was not possible to find a valid test.
Las distribuciones entre los diferentes años no difieren mucho. Sin embargo, al generar una prueba estadística inferencial, no fue posible encontrar un test válido.
Las distribuciones entre los diferentes años no difieren mucho. Sin embargo, al generar una prueba estadística inferencial, no fue posible encontrar un test válido.
I am going to try to use inferential statistics, in order to determine if the differences are significant
I am going to try to use inferential statistics, in order to determine if the differences are significant
This figure shows a comparison between men and women deceased in 2019. The number in the upper part is the p-value of the comparison, “No test” means that the LocationEquivalenceTest did not find a valid test to compare the two vectors, like shown up here. There are significant variations in the age rank: 65-79 and 80-89
Esta figura muestra una comparación entre hombres y mujeres fallecidos en 2019. El número en la parte superior es el valor p de la comparación, “Sin prueba” significa que la Prueba de equivalencia de ubicación no encontró una prueba válida para comparar los dos vectores, como se muestra aquí Hay variaciones significativas en el rango de edad: 65-79 y 80-89
Esta figura muestra una comparación entre hombres y mujeres fallecidos en 2019. El número en la parte superior es el valor p de la comparación, “Sin prueba” significa que la Prueba de equivalencia de ubicación no encontró una prueba válida para comparar los dos vectores, como se muestra aquí Hay variaciones significativas en el rango de edad: 65-79 y 80-89
This figure shows a comparison between men and women deceased in 2020 The number in the upper part is the p-value of the comparison, “No test” means that the LocationEquivalenceTest did not find a valid test to compare the two vectors. There are significant variations in the age rank: 65-79 and 80-89.
Esta figura muestra una comparación entre hombres y mujeres fallecidos en 2020 El número en la parte superior es el valor p de la comparación, “Sin prueba” significa que la Prueba de equivalencia de ubicación no encontró una prueba válida para comparar los dos vectores. Hay variaciones significativas en el rango de edad: 65-79 y 80-89.
Esta figura muestra una comparación entre hombres y mujeres fallecidos en 2020 El número en la parte superior es el valor p de la comparación, “Sin prueba” significa que la Prueba de equivalencia de ubicación no encontró una prueba válida para comparar los dos vectores. Hay variaciones significativas en el rango de edad: 65-79 y 80-89.
Now it will be great to compare 2019 vs 2020
Now it will be great to compare 2019 vs 2020
This figure shows a comparison between men 2019 vs 2020. The number in the upper part is the p-value of the comparison, “No test” means that the LocationEquivalenceTest did not find a valid test to compare the two vectors.
Esta figura muestra una comparación entre hombres 2019 vs 2020. El número en la parte superior es el valor p de la comparación, “Sin prueba” significa que la Prueba de Equivalencia de Ubicación no encontró una prueba válida para comparar los dos vectores.
Esta figura muestra una comparación entre hombres 2019 vs 2020. El número en la parte superior es el valor p de la comparación, “Sin prueba” significa que la Prueba de Equivalencia de Ubicación no encontró una prueba válida para comparar los dos vectores.
This figure shows a comparison between women 2019 vs 2020. The number at the top is the p-value of the comparison, “No test” means that the Location Equivalence Test did not find a valid test to compare the two vectors. Comparison is observed in the 0-64 age range without significance.
Esta figura muestra una comparación entre mujeres 2019 vs 2020. El número en la parte superior es el valor p de la comparación, “Sin prueba” significa que la Prueba de Equivalencia de Ubicación no encontró una prueba válida para comparar los dos vectores. Se observa comparación en el rango de edad 0-64 sin significancia.
Esta figura muestra una comparación entre mujeres 2019 vs 2020. El número en la parte superior es el valor p de la comparación, “Sin prueba” significa que la Prueba de Equivalencia de Ubicación no encontró una prueba válida para comparar los dos vectores. Se observa comparación en el rango de edad 0-64 sin significancia.
By sex and age
By sex and age
This figure shows a comparison between men 2019 vs 2020 weekly. The number in the upper part is the p-value of the comparison, “No test” means that the LocationEquivalenceTest did not find a valid test to compare the two vectors.
This figure shows a comparison between men 2019 vs 2020 weekly, until may 6. The number in the upper part is the p-value of the comparison, “No test” means that the LocationEquivalenceTest did not find a valid test to compare the two vectors.
This figure shows a comparison between women 2019 vs 2020 weekly. The number in the upper part is the p-value of the comparison, “No test” means that the LocationEquivalenceTest did not find a valid test to compare the two vectors.
This figure shows a comparison between women 2019 vs 2020 weekly,until may 6. The number in the upper part is the p-value of the comparison, “No test” means that the LocationEquivalenceTest did not find a valid test to compare the two vectors.
Covid Death
Covid Death
Now it would be interesting to see how COVID deaths are distributed in different countries. The data was obtained from https://ourworldindata.org/covid-deaths#acknowledgements
Deaths
Deaths
The number of deaths this year compared to last year does not conclusively indicate that COVID 19 will be having an impact on mortality. However, in general the models do not take into account (because they cannot) the effect of quarantine on health. In principle, the quarantine was established, not to avoid deaths, but so that the deaths occur gradually, taking into account that the virus has a Ro of 3, higher than influensa, it is probable that the number of infected in the world is several orders of magnitude greater than the current one. By the time the quarantine started, there were already more than 30 million infected with influensa, only in the USA (https://www.cdc.gov/flu/about/burden/preliminary-in-season-estimates.htm).
Second, quarantine keeps the organism isolated from the pathogens it is usually subjected to, which can lead to a disproportionate increase in other diseases, this is known as the hygienist hypothesis, that is, the progressive weakening of the immune system due to the impossibility of this coming into contact with pathogens. Additionally, the lack of sun exposure decreases the synthesis of vitamin D, essential for the functioning of the immune system.
As a third element, we must talk about stress caused by confinement, job uncertainty and other sources of stress. Neurohormonal reactions are known to be powerful epigenerators, associated with the development of “physical and mental” illnesses.
Thus, countries with and without quarantine should have the same number of deaths from the disease, but at different rates. However, the death rate in Sweden is not necessarily higher than the countries that used quarantine. The claim that the Swedish experiment failed is a baseless and base claim on models that are unable to contemplate the settler of social and biological events involved.
La cantidad de muertes de este año en comparación con el año pasado no indica de maneta concluyente qeu COVID 19 estará teniendo un impcto en la mortalidad. Ahora bien, en general los modelos no tienen en cuenta (porque no pueden) el efecto de la cuarentena sobre la lasalud. En principio la cuarentena se estabeció, no para evitar las muertes, sino para que las muertes se produjecen de modo paulatino, teniendo en cuenta que el virus tiene un Ro de 3, mayor a la influensa, es probable que la cantidad de infectados en el mundo sea varios ordenes de magnitud mayor al actual. Para cuando la cuarentena inició ya había más de 30 millones de infectados de influensa, solo en USA (https://www.cdc.gov/flu/about/burden/preliminary-in-season-estimates.htm).
En segundo lugar, la cuarentena mantiene al organismo aislado de los patógenos a los está sometido usualmente, lo que puede llevar a un aumento desproporcianado de otras enfermedades, a esto se le conoce como la hipótessis higienista, es decir, el debilitamiento progresivo del sistema inmmune ante la imposibilidad de este de entrar en contacto con patógenos. Adicionalmente la falta de exposción al sol disminuye la síntesis de vitamina D, esencial para el funcionamiento del sistema inmune.
Como tercer elemento, se debe hablar del estrés producto del encierro, la incertidumbre laboral y otras fuentes de estrés. Se sabe que la reacción neuro hormonal son poderosos epigeneradores, se asocian al desarrollo de enfermdades “fisicas y mentales”.
Entonces, los paises con y sin cuarentena deberian tener el mismo número de muertos a causa de la enfermedad, pero a diferente ritmo. Sin embargo, el ritmo de muertes en Sweden no es necesariamente superior a los paises que usaron la cuarentena. La afirmación de que el experimento sueco fracasó es una afirmación infundada y badasa en modelos que no son capaces de contemplar la platora de eventos sociales y biológicos involucrados.
References
References
Rautava S, Ruuskanen O, Ouwehand A, Salminen S, Isolauri E. The hygiene hypothesis of atopic disease—an extended version. J Pediatric Gastroenterol Nutrition 2004; 38: 378-88.
McGeady SJ. Immunocompetence and allergy. Pediatrics 2004; 113 (4): 1107-131.
Eat dirt – The hygiene hypothesis and allergic diseases. New Eng J Med 2002; 347 (12): 930-1.
Strachan DP. Family size, infection and atopy: the first decade of the 'hygiene hypothesis'. Thorax 2000 55: 2-10.
Strachan DP. Hay fever, hygiene, and household size. British Med J 1989; 299: 1259-60.
Martinez FD. The coming-of-age of the hygiene hypothesis. The Respiratory Sciences Center 2001; 2: 129-32.
Von Mutius E, Braun-Fahrlander C, Schierl R, Riedler J, Ehlermann S, Maisch S, et al. Exposure to endotoxin or other bacterial components might protect against the development of atopy. Clinical & Experimental Allergy 2000; 30: 1230-34.
Gelfand EW. The hygiene hypothesis revisited: pros and cons. Medscape 2003.
Murray PR, Rosenthal KS, Kobayanshi GS, Pfaller MA. Microbiología Médica. Cap. 3 –Morfología sintesis y estructura de la pared celular de las bacterias-. 4ª. edición. España: Editorial Elsevier, S.A.; 2002.
Abbas, Lichtman, Pober. Inmunología celular y molecular. Cap.15. Inmunidad frente a los microorganismos. 4ª. edición. Editorial Mc Graw Hill Interamericana; 2002.
Botero B, Restrepo M. Parasitosis humanas. Cap.16. Enfermedades causadas por artrópodos. 4ª edición. Medellín: Editorial Corporación para Investigaciones Biológicas. Colombia; 2003.
Chaouat G. Innately moving away from the Th1/Th2 paradigm in pregnancy. Clinical & Experimental Immunology 2003; 131 (3): 393-65.
Cooper PJ, Chico ME, Rodríguez LC, Ordónez M, Strachan D, Griffin GE, Nutman TB. Reduced risk of atopy among school-age children infected with geohelminth parasites in a rural area of the tropics. J Allergy and Clinical Inmunology 2003; 111 (5): 995-1000.
Shirakawa T, Enomoto T, Shimazu S, Hopkin JM. The inverse association between tuberculin responses and atopic disorder. Science 1997; 275: 77–79.
Majamaa H, Isolauri E. Probiotics: a novel approach in the management of food allergy. J Allergy Clin Inmunol 1997; 99: 179-85.
Wickelgren I. Can worms tame the immune system? Science 2004; 305.
Hill AB. The environment and disease - association or causation? Proc Royal Soc Med 1965; 58: 295-300.
Stanwell-Smith R. The hygiene hypothesis and implications for home hygiene. Italy International Scientific Forum on Home Hygiene (IFH) Next Health Srl, P.le Türr Milano, 2004: 5-20149.
Cooper PJ. Can intestinal helminth infections (geohelminths) affect the development and expression of asthma and allergic disease?Clinical & Experimental Immunology 2002; 128 (3): 398.
Capron A. Helminth infections and allergic diseases: from the th2 paradigm to regulatory networks. Parasite Allergy, Part I. Clinical Reviews in Allergy & Immunology 2004; 26 (1): 25-34.
Maizels RM. Regulation of allergy and autoimmunity in helminth infection. Clinical Reviews in Allergy & Immunology 2003; 26.
Yazdanbakhsh M. Allergy, parasites, and the hygiene hypothesis. Science. 2002; 296 (5567): 490-4.
Yazdanbakhsh M. Parasites and the hygiene hypothesis: regulating the immune system? Parasite Allergy, Part I. Clinical Reviews in Allergy & Immunology. 2004; 26 (1): 15-24.
Vitamin D, the immune system and asthma
Nancy E Lange,Augusto Litonjua,Catherine M Hawrylowicz &Scott
Berger, S. L., Kouzarides, T., Shiekhattar, R., & Shilatifard, A. (2009). An operational definition of epigenetics. Genes & Development, 23(7), 781–783.
Engel, S. M., Berkowitz, G. S., Wolff, M. S., & Yehuda, R. (2005). Psychological trauma associated with the World Trade Center attacks and its effect on pregnancy outcome. Paediatric and Perinatal Epidemiology, 19(5), 334–341.