This research will explore the changes in color values of colorblind images. Using Machine Learning, this research will attempt to change images for the benefit of colorblind people. It will mostly focus of the Deuteranomaly, a type of colorblindness. In order to approach this problem, data will be inputted into a machine learning function, and it will predict the expected output.
After multiple conversions of an image into different color values, we have somewhat succeeded in producing an image that would appear normal when seen by the colorblind people. The final result was not perfect, as there had been slight highlights in the ImageDifference function, but the difference was negligible. The machine learning model produced both forward and backward functions to simulate the colorblindness as well as to reverse it which matched the results from ImageEffect accurately.
After multiple conversions of an image into different color values, we have somewhat succeeded in producing an image that would appear normal when seen by the colorblind people. The final result was not perfect, as there had been slight highlights in the ImageDifference function, but the difference was negligible. The machine learning model produced both forward and backward functions to simulate the colorblindness as well as to reverse it which matched the results from ImageEffect accurately.
Introduction
Introduction
Color blindness is a vision deficiency that takes away a person’s ability to distinguish color. It affects 12 million people or 3.7% of the American population. But among the American population, 7% of the males are colorblind, while a mere 0.4% of females. [2] In order to help color blind people, there have been inventions that "separated" the colors so that they would be able to interpret different colors. In this project, I will use image recognition in order to separate the colors so that it would be easier for the color blinded to recognise more easily. I will also use machine learning in order to predict the color values that appear in the vision of the colorblind. Lastly, I test the prediction accuracy of my model using the different functions that change the image.
Ishihara Color Test
Ishihara Color Test
The Ishihara color test is a test for anyone with the red or green colorblind, which include Deuteranomaly, Protanomaly, Protanopia, and Deuteranopia. It was created 1917 and designed by Shinobu Ishihara. [1] It has been used since then, and has been used around the world. This essay will primarily focus on Deuteranopia, since a Wolfram function has been provided for Deuteranopia.
Objective of this Study
Objective of this Study
This study aims to create a set of images that enhance the visibility of the colorblind population. To achieve this goal, I have gone through three major tasks. First, I collect two sets of images - one is the normal images that fit well to the visibility of the general population that does not have a colorblindness; and the second is the images that reflect the colorblind people's vision. Second, I trained the machine earning model with different colors. Finally, I predict the impaired image of a normal image using the estimated machine learning model. The following of this essay will summarize each task, respectively.
Simply put, I will try to replicate the effects of the function ImageEffect. ImageEffect is a Wolfram function that when inputted and image, will output another image when viewed by colorblind people. After our machine learning model succeeds to replicate that function, I will attempt to reverse the effects of ImageEffect. Then finally, when my model passes all the supposed tests, I will run the ImageEffect inverse that was created through machine learning on a regular image so that the image will look normal in a colorblind person's eyes.
Simply put, I will try to replicate the effects of the function ImageEffect. ImageEffect is a Wolfram function that when inputted and image, will output another image when viewed by colorblind people. After our machine learning model succeeds to replicate that function, I will attempt to reverse the effects of ImageEffect. Then finally, when my model passes all the supposed tests, I will run the ImageEffect inverse that was created through machine learning on a regular image so that the image will look normal in a colorblind person's eyes.
Difference between 'normal vision' and colorblind vision
Difference between 'normal vision' and colorblind vision
Color blindness is a vision deficiency, which changes the values of colors. In the case where the color is graphed through "Hue","Saturation", and "Brightness", the values of the colors change in all three parameters. The function ImageEffect used in the code below converts a regular image into an image colorblind people would see.
Normal People
In[]:=
normalImage=Image[Table[ConstantImage[Hue[h, 0.75, 0.8], 20], {h, 0, 0.8, 0.2}]]normalImageData=ImageData[#]&/@normalImage;normalImageData2=Flatten[normalImageData,2];
Out[]=
,

,

,

,


Colorblind People
In[]:=
colorblindImage=Image[Table[ImageEffect[ConstantImage[Hue[h, 0.75, 0.8], 20],"Deuteranopia"], {h, 0, 0.8, 0.2}]]colorblindImageData=ImageData[#]&/@colorblindImage;colorblindImageData2=Flatten[colorblindImageData,2];
Out[]=
,

,

,

,


The graphic below shows how colors for normal people would change to colors for colorblind people.
directions=Transpose[{normalImageData2,colorblindImageData2}];
In[]:=
Graphics3D[{{Hue[#],PointSize->0.05,Point[#]}&/@normalImageData2,{Hue[#],PointSize->0.05,Point[#]}&/@colorblindImageData2,Gray,Arrow[{#[[1]],#[[2]]}]&/@directions},PlotRange->{{0,1},{0,1},{0,1}},AxesTrue,AxesLabel{"Red","Green","Blue"},PlotLabel"How color perception changes in a colorblind person"]
Out[]=

The graphs above illustrate the change in the color values as seen by a colorblind person. By being colorblind, you will not be able to see vibrant colors.
Creating the Training Data for the Machine Learning Model
Creating the Training Data for the Machine Learning Model
In this section, we will create data to be used in the machine learning process.
Normal vision
In[]:=
normal=Flatten[Table[{r,g,b},{r,0,1,0.1},{g,0,1,0.1},{b,0,1,0.1}],2];
The data created in 'normal' creates equally spaced out points with different color values.
In[]:=
Graphics3D[{RGBColor[#],Point[#]}&/@normal,PlotLabel"Normal Vision Data"]
Out[]=

In the function below, we are changing an image into an image as viewed by colorblind people. If we were to use the ImageEffect regularly, the ML model would not be able to differentiate the Red and Green. To avoid that, we are blending the colorblind image with the original image in equal proportion in order to have a more ‘mild version’ of the image so that we can emulate what a mildly colorblind person would see image.
A function that changes an image so that it would be easier for the machine to process. Also changes an image into the vision of a colorblind person.
In[]:=
afterEffect[colorValue_]:=Module[{probeImage,effectImage,effectValue},probeImage=ConstantImage[RGBColor[colorValue],1];effectImage=ImageEffect[probeImage,"Deuteranopia"];effectValue=ImageData[effectImage][[1,1]];0.5effectValue+0.5colorValue]
Colorblind Vision
In[]:=
colorblind=ParallelMap[afterEffect[#]&,normal];
This exemplifies the different way afterEffect changed the colors from 'normal'.
In[]:=
Graphics3D[{RGBColor[#],Point[#]}&/@colorblind,PlotLabel"Colorblind Vision Data"]
Out[]=

The two elements, colorblind and normal, will be inputted into the machine learning model in order to train it to replace the ImageEffect function. We need to copy this function so that we can find its inverse later in order to undo the effect of colorblindness.
Test Image
Test Image
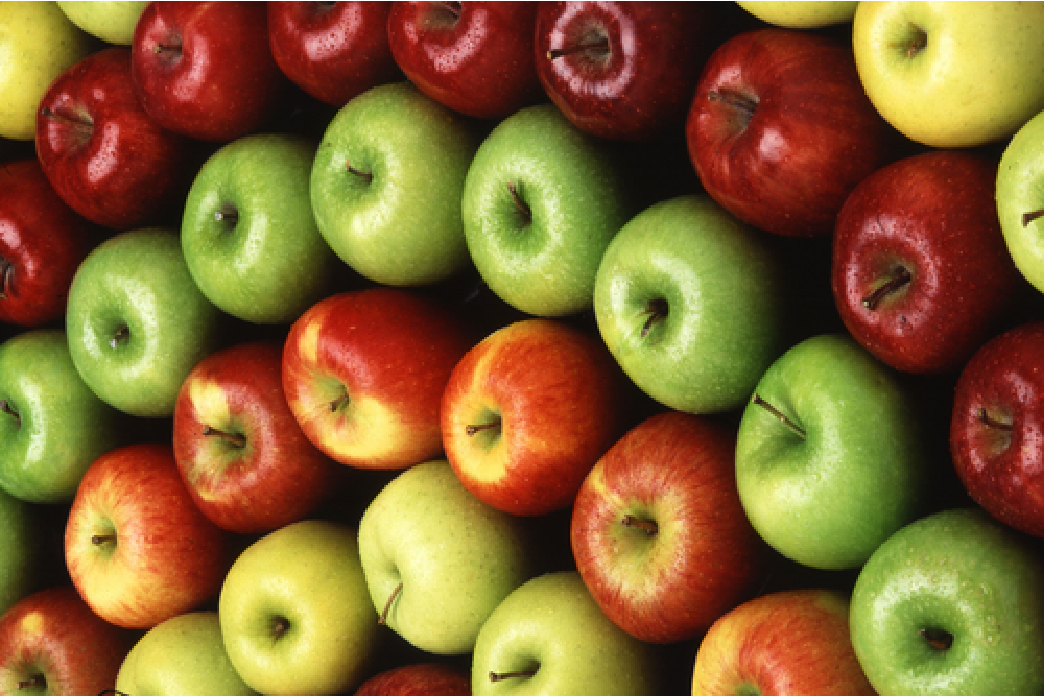
The data acquired in this section is to be used as test data in order to test if the machine learning model is accurate.
Regular Image
In[]:=
imageSize=500;
In[]:=
testImage=ImageResize[ExampleData[{"TestImage","Apples"}],imageSize]
Out[]=
In[]:=
testImageData=Flatten[ImageData[testImage],1];
Colorblind Image
Machine Learning Model
Machine Learning Model
The predict function is an important part of this project. By plugging in the values found earlier ('normal' and 'colorblind'), the predict function, when arranged correctly, will return the accurate image. In other words, the accurate image might look different in the eyes of normal people, but it in the eyes of colorblind people, the image will look more vibrant and more 'normal'.
Replicating the Image Effect Function
Replicating the Image Effect Function
As a experimental, we will recreate the ImageEffect function. In other words, we will try to create multiple functions that changes an image so that it would like an image that a colorblind person sees.
Testing the functions
Testing the functions
The image on the left is the image that was created through the predict function, and the image on the right is the expected outcome created through the afterEffect function (function created above that made a colorblind image more ‘mild’) .
This tests the difference between the predicted image and the original image. Since the output is black, it signifies that both inputs are exactly alike. Here, we will compare 'predictCBImage', which is the image that we have just created, and the 'testImageColorblind', which is the colorblind image. Our efforts to replicate the process of ImageEffect was a success.
Reversing the Image Effect Function
Reversing the Image Effect Function
Now that we are sure that the predict functions work, we will now inverse the function so that if a colorblind image is inserted, a normal image would be outputted.
Testing the functions
Testing the functions
The image on the left is the image that was created through the predict function, and the image on the right is the expected outcome (testData).
Once again, to check if the two images are alike, we will use ImageDifference. We will compare predictCBImage2, which is the image we just created, and testImage, which was the normal image.
Inverting the Image
Inverting the Image
In this step, we will apply the functions from the section above on a regular image. By doing this, theoretically, the image should change into an image that normal people see, but in the vision of colorblind people.
Checking solutions
Checking solutions
Converting the final image into a regular image. In other words, an image viewed by normal people.
The image on the left is the one that is shown above. It was created through the machine learning model created in this research. The image on the right is the original image (testData).
There are slight hues in the black background. This signifies the closeness of the created image and the expected outcome.
Future Research
Future Research
Through countless tests, we were able to create a machine learning model that was successful. The image that resulted from our solution is more vibrant and looks different in normal people's eyes. But in the eyes of colorblind people, the image looks 'normal', and they are able to detect red and slightly more green hues.
The image that resulted from this research
But I have had greater ambitions when starting this research, but was not able to fulfill it due to the lack of time and my inexperience. But if I were to improve this research, I would make different functions that would work on Protanopia (also red-green colorblindness) and Tritanopia (blue-green colorblindness).
Conclusion
Conclusion
Deuteranomaly, a type of colorblindness, affects millions of people worldwide. Find a solution for this type of colorblindness is possible through machine learning. Through multiple steps, this paper succeeded in demonstrating the process of changing image into a more understandable image to colorblind people. Even though the result was slightly off, it exemplified how close the solution was to the set model. If there were to be more data inputted during the machine learning phase, then the solution would be more accurate. But for the sake of efficiency, a slightly deterred data set was inputted. This research had been done during a short duration of time and might not be perfect, but it signifies the power Wolfram Language and machine learning has to help people around the world.
Acknowledgements
Acknowledgements
I would like to appreciate everyone in the Wolfram High School Summer Camp for helping me with this research project. Being my first year learning the Wolfram language, I am grateful for this camp for teaching me the basics. I am also very thankful for my Mentor, James Choi, with helping me with my code. He has provided code for me that was greatly helpful towards reaching my goal.
Bibliography
Bibliography