CITE THIS NOTEBOOK: Modeling Market Efficiency Among Bounded Agents Using Causal Graphs by Al Farabie Akanda. Wolfram Community JAN 12 2023.
Borrowing physics to test Eugene Fama’s Efficient Market Hypothesis
Introduction
Introduction
A market is “informationally efficient” if financial markets reflect all publicly available information at any given time. This means that the prices of assets, such as stocks, bonds, and real estate, accurately reflect all the information that is known about the underlying companies or properties.
We repurpose causal worldline projection techniques previously used for modeling relativistic observers in physics to the causal testing of market efficiency for bounded agents with local information. We do so by constructing a causal graph of a generative trading model in which economic agent activity defines a path (or, in physics, worldline). Being bounded, agents have access solely to events that project causally onto their path; i.e. market information that impinges causally on their path (or, in physics, events that are timelike separated from the worldline). Thus, agents lack access to the full causal history of the causal graph (i.e. their ‘past lightcone’); they’re bounded. We examine, for trades made at a given time step, the degree to which they capture all ‘event information’ available at the time by comparing the union of the projection-formed subgraphs with the global causal graph.
We repurpose causal worldline projection techniques previously used for modeling relativistic observers in physics to the causal testing of market efficiency for bounded agents with local information. We do so by constructing a causal graph of a generative trading model in which economic agent activity defines a path (or, in physics, worldline). Being bounded, agents have access solely to events that project causally onto their path; i.e. market information that impinges causally on their path (or, in physics, events that are timelike separated from the worldline). Thus, agents lack access to the full causal history of the causal graph (i.e. their ‘past lightcone’); they’re bounded. We examine, for trades made at a given time step, the degree to which they capture all ‘event information’ available at the time by comparing the union of the projection-formed subgraphs with the global causal graph.
Method
Method
First, we introduce some very fundamental trading laws in a simple economy, and start off building causal graphs to capture the relationship among all the transactions that happen at different time steps .
For example, in a very straightforward economy where the initial condition says owns asset 1 & 2 whereas B owns 3 & 4, we say there exists trading rules "AA" -> "BA" and "BB" -> "AB" such that A can sell one of its assets to B and vice versa . We say “AB”->”BA” and “BA”->”AB” mean one-to-one exchange of assets between A and B.
For example, in a very straightforward economy where the initial condition says owns asset 1 & 2 whereas B owns 3 & 4, we say there exists trading rules "AA" -> "BA" and "BB" -> "AB" such that A can sell one of its assets to B and vice versa . We say “AB”->”BA” and “BA”->”AB” mean one-to-one exchange of assets between A and B.
rules={(*ASSET GENERATION BY D*)"AA"->"AB", "BB"->"BA", "AB"->"BA", "BA"->"AB"};init="AABB";
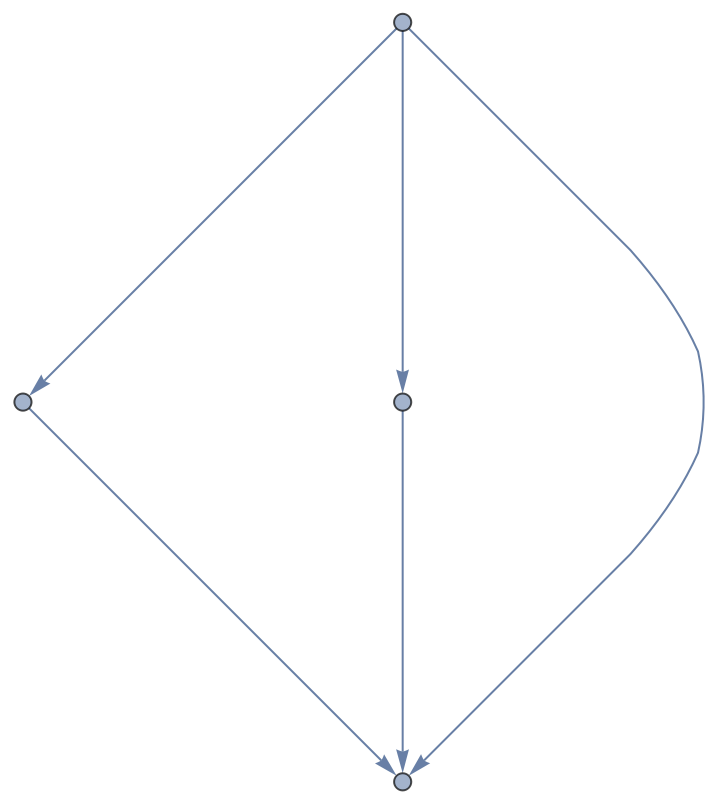
Then we get the following causal relationship between 3 different time steps, where each node in the graph represents a transaction, and directed edges represent causal relationships between the transactions . We then perform causal inference, which is the process of using observations to draw conclusions about the underlying causal relationships in a system .
In[]:=
cg=ResourceFunction["MultiwaySystem"][rules,init,4,"CausalGraphStructure"]
Out[]=
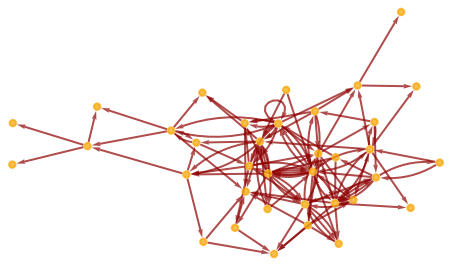
Let’s imagine we have an agent that starts at any edge node and wanders down the direction’s path while observing the transaction, or market knowledge, that causally impinges their path. Therefore, we claim that because agents are constrained, they only encounter transactions that project causally onto their path.
In[]:=
Coordinatize
Out[]=
Coordinatize
In[]:=
<<GeneralUtilities`initEvent=First@GraphSources[cg];sinkPathLengths=AssociationMap[Length@FindPath[cg,initEvent,#,All,All]&,GraphSinks[cg]];observers=Catenate[FindPath[cg,initEvent,#,All,All]&/@Keys@TakeLargest[sinkPathLengths,4]];tcg=TransitiveClosureGraph@cg;
In[]:=
With[{coordinates={1,-1}#&/@Coordinatize[cg,#]},TransitiveReductionGraph@Subgraph[tcg,Keys[coordinates],VertexCoordinates->Normal[coordinates]]]&/@observers[[;;1]]
Out[]=

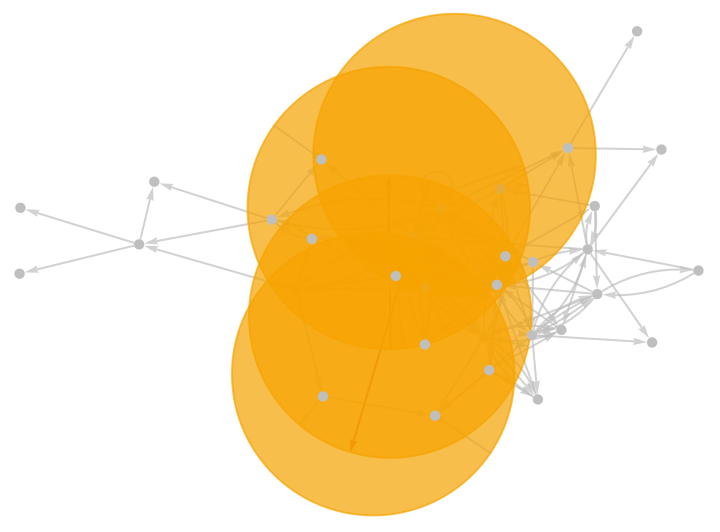
We repeat the process for each potential observer in the system and finally do union all the paths we find. The union graph is then projected onto the original parent graph. The idea is that the two graphs are supposed to exactly coincide if Fama’s efficient market theory is true.
In[]:=
With[{coordinates={1,-1}#&/@Coordinatize[cg,#]},TransitiveReductionGraph@Subgraph[tcg,Keys[coordinates],VertexCoordinates->Normal[coordinates]]]&/@observers[[;;10]]
Out[]=
,
,

,
,

,

,

,
,
,
In[]:=
GraphUnion@@%58
Out[]=
In[]:=
HighlightGraph[cg,%59, VertexSize->10, GraphHighlightStyle->"DehighlightGray"]
Out[]=
Result
Result
From here, we apply our method for relatively complex and larger economies. We identify 2 different kind of market settings to run the test:
Trading Non-Perishable commodities
Trading Non-Perishable commodities
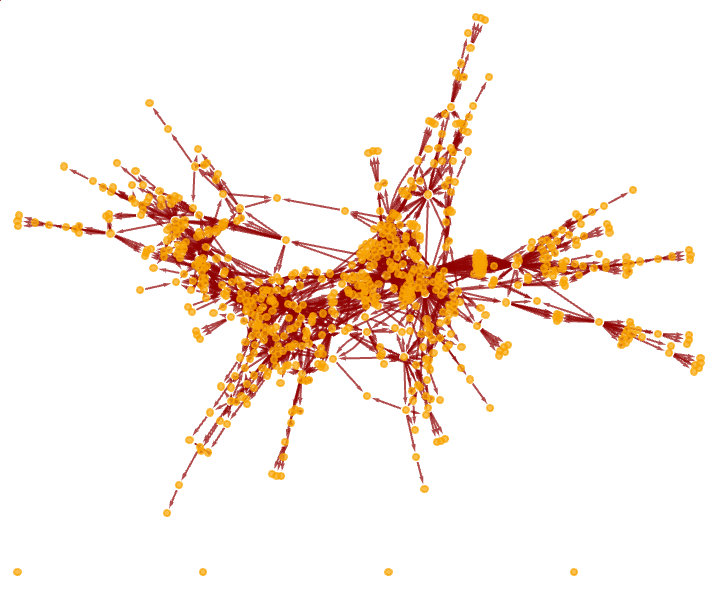
In our simple economy, we assume our non - perishable commodity is gold, which over the time gets mined by D in their mine X and gets exchanged among market agents A, B, C . We assume no gold is destroyed or taken off from the market in this process . While "XA" -> "XAD" represents gold mined by D at X for market agent A, "DA" -> "AA" means gold exchange between the D and A . FInally, "AB" -> "BA" means in market transactions .
rules={(*ASSETGENERATIONBYD*)"XA"->"XAD","XB"->"XBD","XC"->"XCD","XD"->"XDD","XAB"->"XABD","XAC"->"XACD","XBC"->"XBCD","XABC"->"XABCD",(*ASSETEXCHANGEFROMMINERTOMARKET*)"DA"->"AA","DB"->"BB","DC"->"CC",(*ASSETEXCHANGEWITHMARKET*)"AB"->"BA","AC"->"CA","AB"->"BA","BC"->"CB"};init="XAABCDDD";cg=ResourceFunction["MultiwaySystem"][rules,init,6,"CausalGraphStructure"]
Money Flow in a Domestic Economy
Money Flow in a Domestic Economy
We assume at any given time if the money supply from central bank B is fixed, then commercial banks, i . e ., A, C, D, E, are making transactions with B such that "AB" -> "BA". We say money gets out of the trading market too through as clients withdraw their money and through leakage: “AZ”->”ZZ”. We also say that in inflationary times central bank to restrict the supply of money takes money out of circulation : "ABCDEZ" -> "ABCDZZ", "ABCDEZ" -> "ABZZZZ" (The more the Zs, the tighter the policy) .
rules={(*AgentsMakingtransactionsincludingBank-B*)"AB"->"BA","AC"->"CA","BC"->"CB","AD"->"DA","BD"->"DB","CD"->"DC","AE"->"EA","BE"->"EB","CE"->"EC","DE"->"ED",(*MONEYGOINGOUTOFTHEEXCHANGEMARKET*)"AZ"->"ZZ","BZ"->"ZZ","CZ"->"ZZ","DZ"->"ZZ","EZ"->"ZZ",(*BANKRESTRICTSMONEYMOVEMENTINTHEECONOMY*)"ABCDEZ"->"ABCDZZ","ABCDEZ"->"ABCZZZ","ABCDEZ"->"ABZZZZ","ABCDEZ"->"ZBZZZZ"};init="ABBBBBCDDEEE";
Observer Paths and Unions
Observer Paths and Unions
Parent Code for Observer Paths:
Parent Code for Observer Paths:
Output:
Output:
◼
Non - Perishable goods Observer Paths
◼
Money Flow in a Domestic Economy
Unions
Unions
◼
Non - Perishable goods Observer Paths
◼
Money Flow in a domestic economy
Projection and Discussion
Projection and Discussion
Upon projection we see that none of these projections coincide perfectly. Does this mean that the hypothesis is wrong? The simple answer is NO. Our lacking lies in that for simple computation purposes, we couldn’t capture all the observers.
◼
Fig : Projection for Non - Perishable goods Observer Paths
◼
Fig: Projection Money Flow in a domestic economy
We notice in the projection graph that the more observers we have the better the projection. Thus, we conclude it' s safe to assume that it' s computationally possible, even though energy and time consuming, to capture all the observers' pathways such that their union coincides with their global causal graph .
We notice in the projection graph that the more observers we have the better the projection. Thus, we conclude it' s safe to assume that it' s computationally possible, even though energy and time consuming, to capture all the observers' pathways such that their union coincides with their global causal graph .
Future Direction
Future Direction
The project serves as an evidence to the friendship of Physics and Economics by showing how sophisticated interdisciplinary tools, such as multi computation, can be used to challenge, redesign, and advance some of the fundamental theories. This creates opportunities for new inquiries that are specifically relevant to this project, such as the following:
The more knowledge an observer (or agent) possesses, the more advantages are presumably on their side. But can we determine whether the advantage an agent receives from having more access to market information is linear or involves some other factor: that is how to quantify the comparative advantage of having better access to information.
The more knowledge an observer (or agent) possesses, the more advantages are presumably on their side. But can we determine whether the advantage an agent receives from having more access to market information is linear or involves some other factor: that is how to quantify the comparative advantage of having better access to information.
KeyWords
KeyWords
◼
Efficient Market Hypothesis(EMH)
◼
Causal Graphs
◼
Observer Theory
◼
Non-Perishable Commodity
◼
Tight Monetary Policy
Acknowledgement
Acknowledgement
I would like to acknowledge and thank my mentors James Douglas Boyd and Nikolay Murzin for their guidance, technical support, and encouragement. I would also like to thank Stephen Wolfram for providing support with project selection and everyone else in the Wolfram community who made the whole experience enjoyable and accessible.