Suppose we have robust consumer preference data for N fruits of the Prunus family sold in markets of a well-defined demographic region.There are N values.Now we perform cluster analysis. It will use the nearest function to determine which elements are closest in value. Typically all differences in value will be unique. If not, one hopes the cluster analysis software has an accommodation for it.Some investigators would like to equivocate the difference function used by nearest to distances, but I caution that if you check as a group the N×(N-1) differences form a qualified distance metric (e.g., satisfy the triangle inequality) you will typically fail. If not, rejoice!Here’s an example of 3 fruits, for which the difference function in cluster analysis is valid, but the analogy to a distance metric is false.Let =Abs[value[[i]]-value[[j]]]:
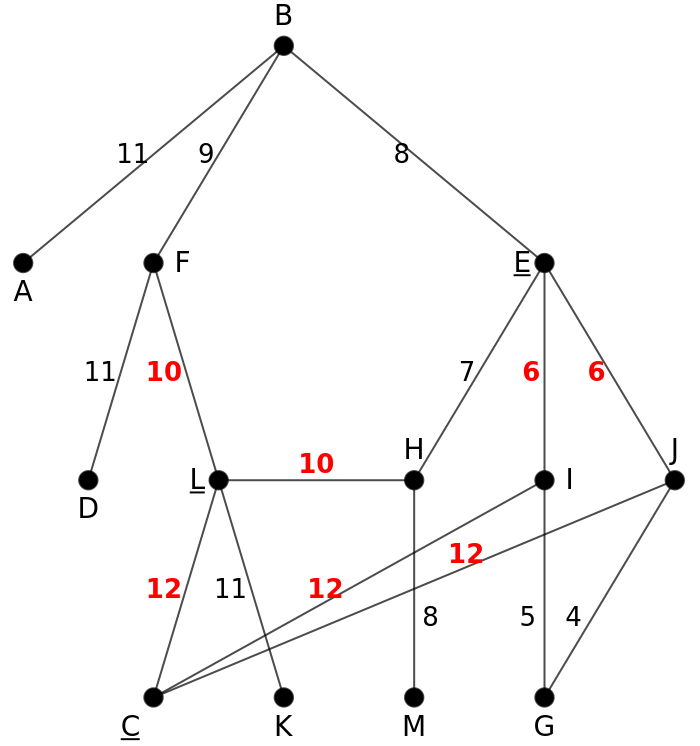
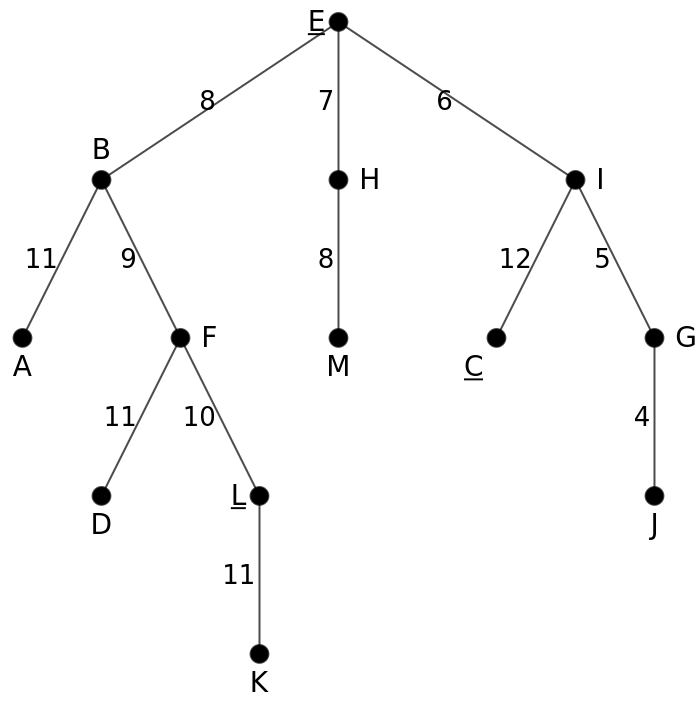
>+, failing the triangle inequality.Now let’s take those same N fruits of the Prunus family and obtain their genetic profiles,and using a qualified distance metric obtain the genetic distances between the fruit cultivars.There are N×(N-1) values.Now we perform cluster or dendrogram analysis. If the nearest-neighbor algorithm does not account for multiplicity (i.e. two neighbors of a profile with the same nearest neighbor distance), then the resulting analysis will be erroneous for many application areas, although not for all. For example, it is of no consequence for software compilers.Here is an example of failure with a nearest neighbor algorithm not accounting for multiplicity.On the left, a graph of distance measures with multiplicity at vertices C, L, and E. On the right, the erroneous nearest-neighbor rendering by an algorithm ignoring multiplicity. In particular, the graph is missing 2 of 3 k=1 edges of C, and 1 of 2 k=1 edges of both L and E.
1
2
a
i,j
0 | 2 | 7 |
2 | 0 | 3 |
7 | 3 | 0 |
a
1,3
a
1,2
a
2,3
1
2