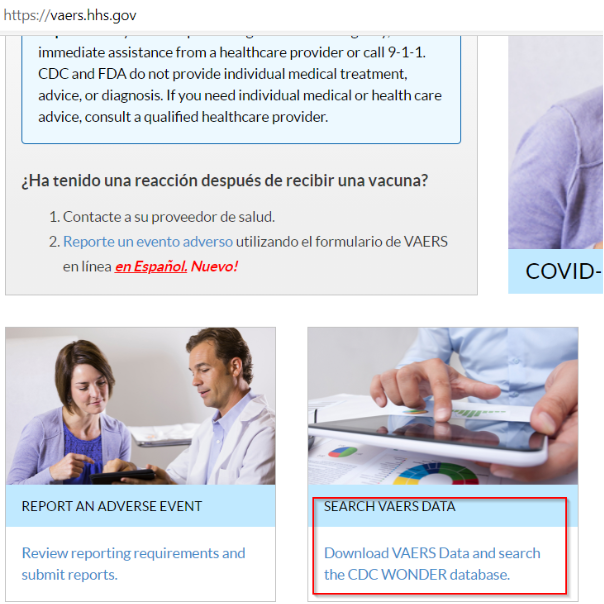
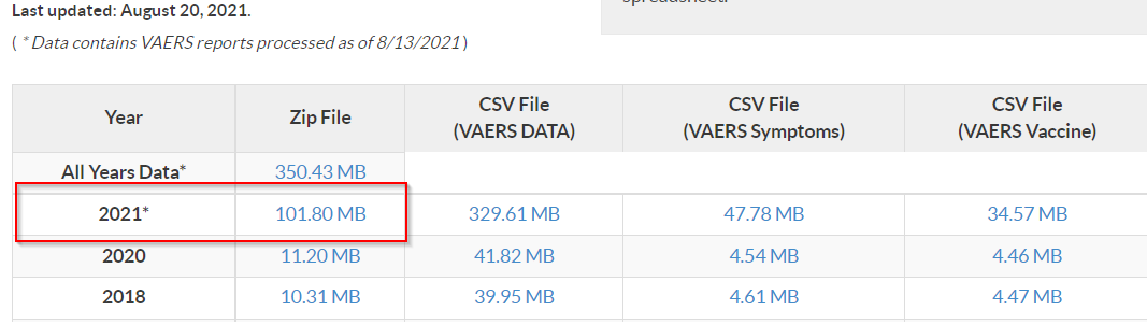
VAERS is co-administered by the Food and Drug Administration (FDA) and the Centers for Disease Control (CDC).The goal is data collection of suspected adverse events, including all vaccine adverse reactions for the United States of America (USA)Database is freely accessible at https://vaers.hhs.gov/ and updated on a weekly basis.I’ve downloaded 2021 data relevant for COVID19 vaccine campaignsEach zip includes 3 CSV file : VAERSDATA, VAERSVAX and VAERSSYMPTOM, the content of each file is documented at https://vaers.hhs.gov/docs/VAERSDataUseGuide_November2020.pdf The objective is to explore , analyse and visualise VAERS data using SQL functions described in my previous post. The last versions of SQL functions could be found at https://www.wolframcloud.com/env/damcalrom/Published/SQLOperators.wl
Load SQL functions
Load SQL functions
Load package containing SQL functions
In[]:=
CloudImport["https://www.wolframcloud.com/env/damcalrom/Published/SQLOperators.wl"];
Load data
I’m using only VAERSDATA, VAERSVAX for now. I extract the files locally on my deskstop and then import in sql tables.
The file was downloaded 18-08-2021 so if you reproduce the analysis you probably obtain different numbers.
The file was downloaded 18-08-2021 so if you reproduce the analysis you probably obtain different numbers.
In[]:=
(*getcolumnnamesfromfirstline*)colsvaers=Import["C:\\calin\\Covid\\VAERS\\2021VAERSDATA.csv",{"Data",{1}}]//Flatten//Map[StringReplace[#,"_"""]&,#]&;colsvax=Import["C:\\calin\\Covid\\VAERS\\2021VAERSVAX.csv",{"Data",{1}}]//Flatten//Map[StringReplace[#,"_"""]&,#]&;
In[]:=
(*importintoSQLtables*)tbvaers=importSQL["C:\\calin\\Covid\\VAERS\\2021VAERSDATA.csv",",",colsvaers];//AbsoluteTimingtbvax=importSQL["C:\\calin\\Covid\\VAERS\\2021VAERSVAX.csv",",",colsvax];//AbsoluteTiming
Out[]=
{17.5064,Null}
Out[]=
{3.87283,Null}
Explore raw data
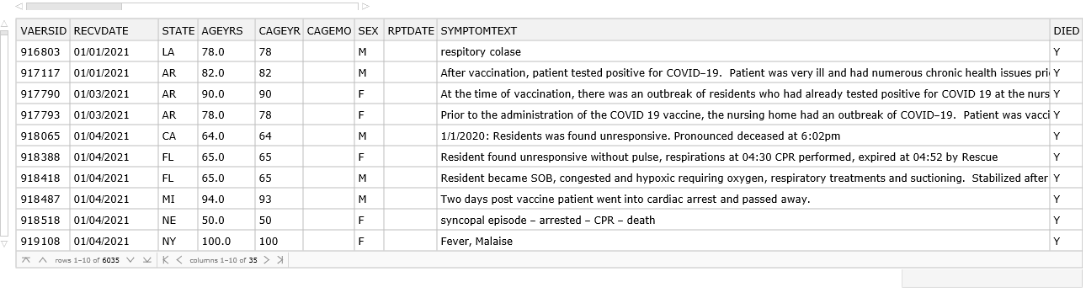
VAERSDATA table using various filters to have first look at the data
In[]:=
tbvaers//(*whereSQL[#,StringContainsQ[SYMPTOMTEXT,"death"]]&//*)whereSQL[#,StringContainsQ[DIED,"Y"]]&//(*whereSQL[#,VAERSID1384808]&//*)tableSQLAsDataset
Out[]=
VAERSVAX table
Warning !!! Table contains duplicates.
Display duplicates ordered by count
Warning !!! Table contains duplicates.
Display duplicates ordered by count
In[]:=
tbvax//groupBySQL[#,{VAERSID,VAXNAME}]&//summarySQL[#,Association["cnt"(VAERSID//Length)]]&//whereSQL[#,cnt>1]&//orderBySQL[#,{-cnt}]&//showTableSQL
Total Rows:15312 Elapsed:12.3768
Out[]//TableForm=
VAERSID | VAXNAME | cnt |
962303 | VACCINE NOT SPECIFIED (NO BRAND NAME) | 11 |
1215401 | COVID19 (COVID19 (JANSSEN)) | 10 |
1165811 | VACCINE NOT SPECIFIED (NO BRAND NAME) | 5 |
947846 | COVID19 (COVID19 (PFIZER-BIONTECH)) | 4 |
960388 | VACCINE NOT SPECIFIED (NO BRAND NAME) | 4 |
988925 | COVID19 (COVID19 (MODERNA)) | 4 |
1045638 | VACCINE NOT SPECIFIED (NO BRAND NAME) | 4 |
1046006 | COVID19 (COVID19 (PFIZER-BIONTECH)) | 4 |
1059364 | COVID19 (COVID19 (MODERNA)) | 4 |
1078879 | COVID19 (COVID19 (PFIZER-BIONTECH)) | 4 |
Check an example of duplicate in detail
In[]:=
tbvax//whereSQL[#,VAERSID962303]&//tableSQLAsDataset
Out[]=
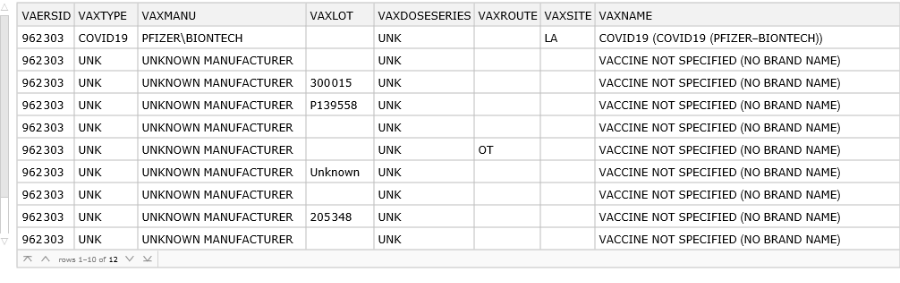
I use projectSQL on a group of cols to keep a single line per vaxtype , vaxname etc
In[]:=
tbvax//whereSQL[#,VAERSID962303]&//projectSQL[#,{VAERSID,VAXTYPE,VAXMANU,VAXNAME}]&//tableSQLAsDataset
Out[]=

Data transformation
Data transformation (calculated columns , custom functions )
In[]:=
(*functiontocalculateagegroupbasedoncustomintervalofages*)ageGroupInterval[x_,range_List]:=range//Partition[#,UpTo[2],1]&//Cases[#,{min_,max_}/;x>min&&x≤maxStringRiffle[{min,max},"-"]]&//Check[#//First,"UNKNOWN"]&//Quiet;ageGroupInterval[15,{0,6,12,18,30,50,70,90,110}]
Out[]=
12-18
In[]:=
tbvaers1= tbvaers//(*convertrodatedatatype*)(*rowMapSQL[#,{VAXDATE,ONSETDATE},(DateObject[{#,{"Month","Day","Year"}}]//Check[#,Missing[]]&)&]&//*)(*calculatenodaysbetweenvaccinationandapparitionofsymptom*)addColumnsSQL[#,Association[(*"ONSETDAYS"(DateDifference[VAXDATE,ONSETDATE]//Quiet),*) "AGEGRP"ageGroupInterval[AGEYRS,{0,6,12,18,30,50,70,90,110}] ]]&;//AbsoluteTiming
Finally I joined VAERSDATA and VAERSVAX on VAERSID column into a final table used to visualize data
Explore final table
Visualisations
Visualisations
Number of AE by vaxtype for top 10 contributors
Number of deaths by vaxtype for top 10 contributors
COVID VAccines AE by Age Groups
Deaths by Age Groups
Time to death
Time to death by COVID manufacturer
Detail Deaths per Covid Vaccine and agegroup
Detail Deaths per Covid Vaccine and sex
References
References