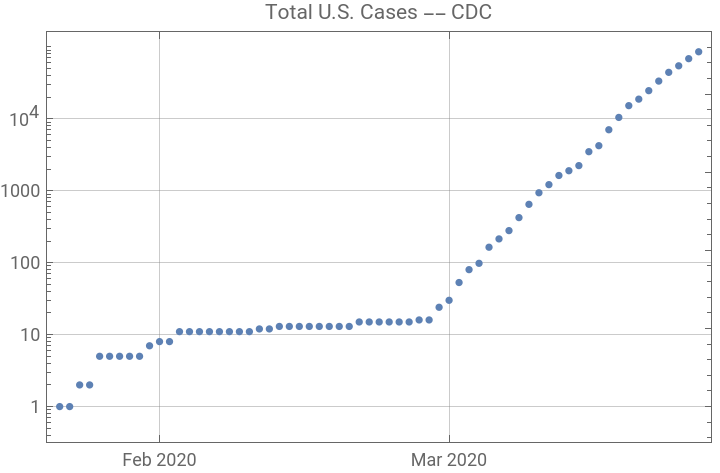
I don’t know how long this will last but here is the path to CDC JSON data on cumulative cases used in a new graphic on CDC website.
In[]:=
cdcJSON=Import["https://www.cdc.gov/coronavirus/2019-ncov/cases-updates/total-cases-onset.json","RawJSON"];
In[]:=
cdcData=Rest/@cdcJSON["data"]["columns"]
Out[]=
{{1/22/2020,1/23/2020,1/24/2020,1/25/2020,1/26/2020,1/27/2020,1/28/2020,1/29/2020,1/30/2020,1/31/2020,2/1/2020,2/2/2020,2/3/2020,2/4/2020,2/5/2020,2/6/2020,2/7/2020,2/8/2020,2/9/2020,2/10/2020,2/11/2020,2/12/2020,2/13/2020,2/14/2020,2/15/2020,2/16/2020,2/17/2020,2/18/2020,2/19/2020,2/20/2020,2/21/2020,2/22/2020,2/23/2020,2/24/2020,2/25/2020,2/26/2020,2/27/2020,2/28/2020,2/29/2020,3/1/2020,3/2/2020,3/3/2020,3/4/2020,3/5/2020,3/6/2020,3/7/2020,3/8/2020,3/9/2020,3/10/2020,3/11/2020,3/12/2020,3/13/2020,3/14/2020,3/15/2020,3/16/2020,3/17/2020,3/18/2020,3/19/2020,3/20/2020,3/21/2020,3/22/2020,3/23/2020,3/24/2020,3/25/2020,3/26/2020},{1,1,2,2,5,5,5,5,5,7,8,8,11,11,11,11,11,11,11,11,12,12,13,13,13,13,13,13,13,13,15,15,15,15,15,15,16,16,24,30,53,80,98,164,214,279,423,647,937,1215,1629,1896,2234,3487,4226,7038,10442,15219,18747,24583,33404,44183,54453,68440,85356}}
In[]:=
dates=Quiet@DateObject[DateList[#],"Day"]&/@cdcData[[1]];
In[]:=
cdcTS=TimeSeries@Transpose[{dates,ToExpression/@cdcData[[2]]}]
Out[]=
TimeSeries


In[]:=
DateListLogPlot[cdcTS,JoinedFalse,GridLinesAutomatic,PlotLabel"Total U.S. Cases -- CDC"]
Out[]=