To achieve a satisfatory wing design can be a time-consuming task, due to the inumerous airfoil shapes an engineer need to compute before reaching desirable aerodynamical parameters. This project intends to develop an optimal solution, through machine learning methods, that finds a list of NACA airfoils which matches the physical characteristics, or the closest possible results within the Dataset.
NACA AIRFOILS NACA airfoils are commonly a first approach in Aerodynamics. They were wing section formats reported and largely studied by the National Advisory Committee for Aeronautics (NACA) research and development, predecessor of the currently National Aeronautics and Space Administration (NASA). Their designation (with 4 digits or 5 digits series being approached in this project) are very specific coefficients which describe their coordinates, allowing an aerodynamicist to easily model and simulate them with the panel method (an approach of Computational Fluid Dynamics).As the public texts of the NACA Technical Reports no. 460 and no. 537 display summaries of the main performance characteristics for two-dimensional aerodynamics of a large number of this Airfoils, gathering the experimental (and very reliable) data became the first step to implement the function. It is important to state that experimental procedures are more precise than simulations, therefore more close to reality.The whole historical development of the NACA airfoils, as well as its mathematical foundations, are precisely reviewed in the NACA Technical report no. 824.
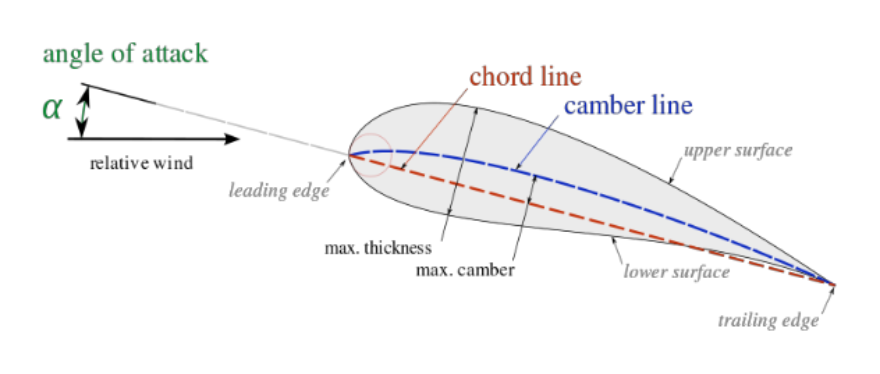
FOUR DIGIT SERIES The first series of these airfoil were largely tested on wind tunnels, and have a very clear and useful designation:

FIVE DIGIT SERIES The main difference between this designation and the previous one relies on the possibility of reflexed camber lines. The first digit now displays a theoretical lifting coefficient. Also, the third digit states if it has a reflexed or simple camber:
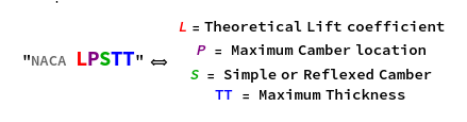
And their main characteristics were extracted from NACA’s reports, written in .csv archives and displayed as in the following dataset:
Returns the DataSet built throughout the project
naca4DigitsDataset=Import["/home/saulo/data4digits.m"]naca5DigitsDataset=Import["/home/saulo/data5digits.m"]
Out[]=


Out[]=
PROCEDURAL To identify a general airfoil, the following function was built to measure it’s main physical characteristics. Some other functions were built throughout the projet, making use of some machine learning functions such as Classify and Predict, to determine the reflexed nature of the airfoil, and Nearest, to provide the closest known airfoils within the training Dataset. It is important to state that the coordinates of the unknown arfoil need to be evaluated from the trailing edge, counterclockwise.
In[]:=
nearestAirfoil[coordinates_?ListQ]:=Module[{upper,lower,camber,maxCamber,posMaxCamber,maxThickness,nearest4,nearest5},upper=Sort@Take[coordinates,UpTo[Position[coordinates,{0.,0.}]〚1,1〛]];(*theuppersurface*)lower=Drop[coordinates,Position[coordinates,{0.,0.}]〚1,1〛-1];(*thelowersurface*)camber=((upper+lower)/2)[[All,2]];maxCamber=Max@camber;(*evaluatesthemaximumcamber*)posMaxCamber=((upper+lower)/2)〚Part[Flatten@Position[camber,maxCamber],1],1〛;(*returnsthepositionofthemaximumcamber*)maxThickness=Max@(upper-lower)〚All,2〛;(*returnsthepositionofmaximumthickness*)nearest4=find4@fourDigitSeries[{{100000*Round[maxCamber,0.01]},{1000*Round[posMaxCamber,0.1]},{100*Round[maxThickness,0.01]}}];nearest5=First@find5@fiveDigitSeries[posMaxCamber,maxCamber,100*Round[maxThickness,0.01]];Return[{nearest4,nearest5}]]
The outputs are a fast and resourceful way to first identify an airfoil’s characteristics, as follows in the example of an random airfoil analysed with the function. Although the values are probably less accurate than a simulation approach, and besides being a lot easier and faster to implement, they are a good comparing point, mainly for airfoils with less complex shapes, which can easily fit in the Dataset.
display=Graphics@Line@coordinatesd4=naca4DigitsDataset[Select[#AirfoilToString@nearestAirfoil[coordinates][[1,1]]&],All]d5=naca5DigitsDataset[Select[#AirfoilToString@nearestAirfoil[coordinates][[2,1]]&],All]
Out[]=
Out[]=
Out[]=
POSSIBILITIES Gathering data was clearly the main difficult about this project, but it happened to show great results. A larger amount of data, a well trained Neural Network and large amount of coordinates seem to be a promising feature to generate very accurate results, but it would not have been possible for a 3 week project.
Keywords
Keywords
◼
Airfoil
◼
Aerodynamics
Acknowledgment
Acknowledgment
Mentor: Daavid Väänänen
Jesse Galef
References
References
◼
Gudmundsson, Snorri. General aviation aircraft design: Applied Methods and Procedures. Butterworth-Heinemann, 2013.
◼
Abbott, Ira H., Albert E. Von Doenhoff, and Louis Stivers Jr. “Summary of airfoil data.” (1945).
◼
Abbott, Ira H., and Albert E. Von Doenhoff. Theory of wing sections: including a summary of airfoil data. Courier Corporation, 2012.