In “Games and Puzzles as Multicomputational Systems” by Stephen Wolfram, he writes “ in a multicomputational system the key idea is that states can have multiple successors—and tracing their behavior defines a whole multiway graph of branching and merging threads of time. And the point is that this is directly related to how one can think about typical games and puzzles”. My project focuses on building on this framework, and modeling various game boards of peg solitaire, exploring different board shapes and initial peg arrangements in order to identify patterns within these multiway graphs in particular I analyzed transformations of boards, and how graphs can fit into each other. This project enables further research into how analyzing smaller boards can help us understand and simplify graphs of larger game boards, and how real life systems that can be modeled by graphs can also be broken down into smaller parts in this way.
Peg Solitaire
Peg Solitaire
Peg Solitaire, or as it’s known in Europe, Solitaire, is a one player board game where each move consists of jumping pegs over each other on a board. The game was first made in 1697 France, in the court of Louis XIV, where it was written about in the French magazine Mercure galant, which contained a description of the board, rules and sample problems. While the first versions of the game consisted of a hexagonally shaped board, there are now many different shapes and configurations of pegs used in games.
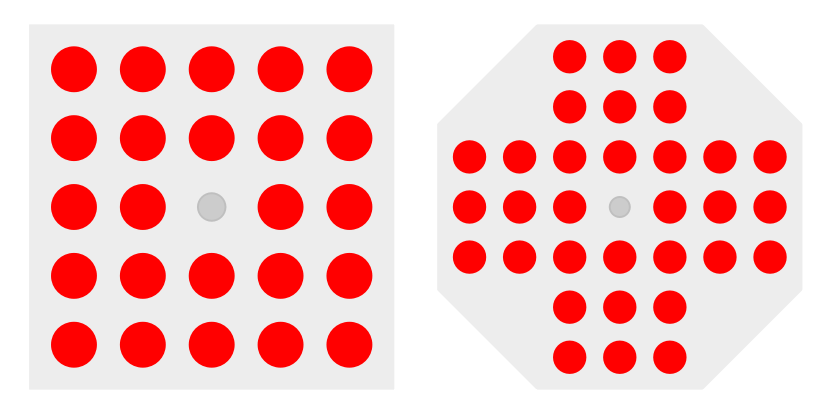
The rules for the game are very simple, pegs (or marbles in some versions) are jumped over each other in a similar way to how pieces in checkers move when they are capturing pieces. Moves can only be made horizontally and vertically, and each move removes exactly one peg from the board. The objective of the game is to be able to remove all but one piece from the board.
Example Game:
Example Game:
Out[]=
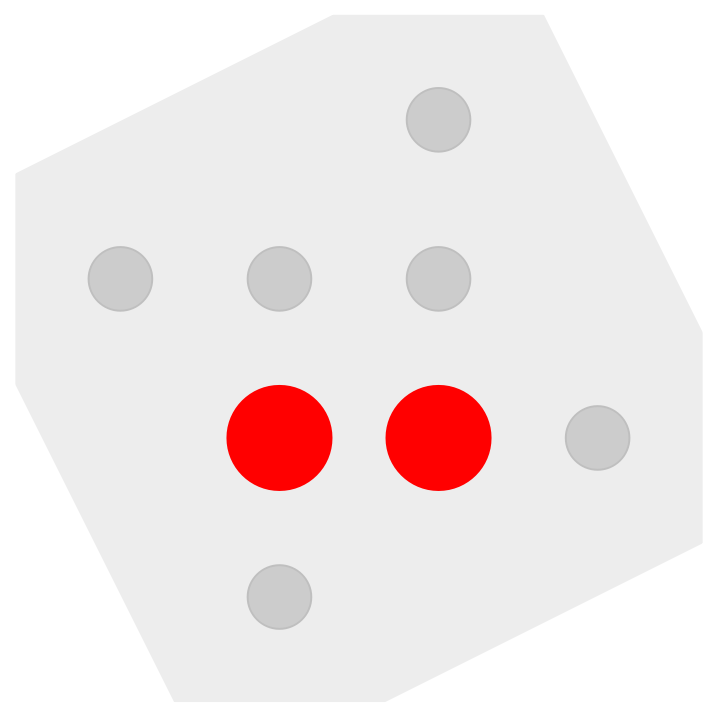
Creating Multiway Graphs
Creating Multiway Graphs
Multiway graphs are graphs which represent all possible paths in a system. Each of the nodes in our multiway graphs represents a different game state which can be reached from the one previous, and each edge, or arrow, between nodes is a move.
In multiway graphs of peg solitaire, each movement down the graph removes exactly one peg from the game board, and no pegs can be added back, meaning the graph will only move downward and never loop.
Here is the multiway graph of the game shown above.
In multiway graphs of peg solitaire, each movement down the graph removes exactly one peg from the game board, and no pegs can be added back, meaning the graph will only move downward and never loop.
Here is the multiway graph of the game shown above.
Out[]=
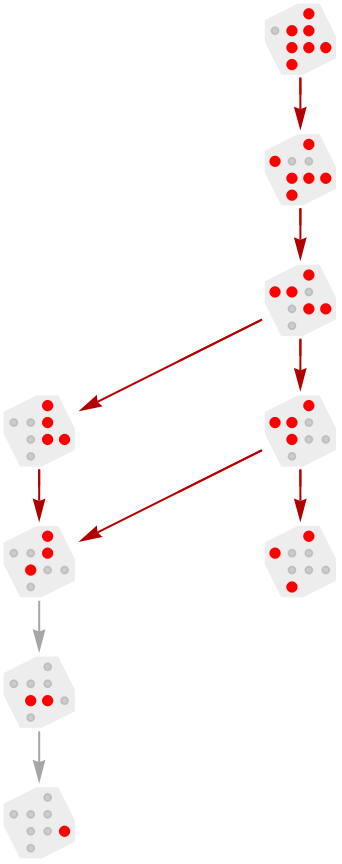
To generate the graphs for peg solitaire, I first created a function which would create a graph of the game without visuals showing game states, shown here. This function was directly pulled from code in Steven Wolfram’s writing “Games and Puzzles as Multicomputational Systems”, which was the main jumping off point for this project and provided me with many of the resource functions I use such as Nest While Graph, Iterate TPS Move, and Peg Solitaire Graphics.
This function graphgen utilizes the resource functions NestWhileGraph and IterateTPSMove to generate a node diagram for my multiway graphs, which I will then put graphics over to show the board states at different points in the game. IterateTPSMove provides all the next possible moves given a move set and game state, and NestWhileGraph simply iterates this process over while there are possible moves left on the board.
In[]:=
graphgen[start_,moves_]:=[moves],{start},UnsameQ@@#&,2
To make my life easier, and my code more readable, I created a function which takes in a list of coordinate pairs ex: {{1,1},{1,2},{1,3}} and gives each of them “names” ex: {{1,1}->1,{1,2}->2,{1,3}->3} so that they are properly formatted for the IterateTPSMove and PegSolitaireGraphics functions.
In[]:=
coordnames[coords_]:=MapIndexed[#1->#2[[1]]&,coords]
All of this built up to creating a base multiway graph function, this takes in a list of coordinate pairs, a starting board state, and a list of possible moves that can be made on the board and outputs a full multiway graph of the board. It first creates the node graph of the game states, and then uses the PegSolitareGraphics resource function, which creates images for game boards given coordinates and node states to create the images for each node. Board states are stored as a list of 1’s and 0’s referring to “in” or “out” pegs.
In[]:=
multiwaygraph[coords_,start_,moves_]:=Graphgraphgen[start,moves],VertexShapeFunctionInset[coordnames[coords]][#2],#1,Center,#3&,VertexSize1.2,PerformanceGoal->"Quality",EdgeStyleGray,GraphLayout"LayeredDigraphEmbedding",AspectRatio3
In[]:=
multiwaygraph[{{1,3},{2,1},{2,2},{2,3},{3,2},{3,3},{3,4},{4,2}},{0,1,1,1,1,1,1,1},{{1,4,6},{7,6,5},{3,5,8},{4,3,2}}]
Out[]=
Removing “Duplicate” Board States Using Image Transformations
Removing “Duplicate” Board States Using Image Transformations
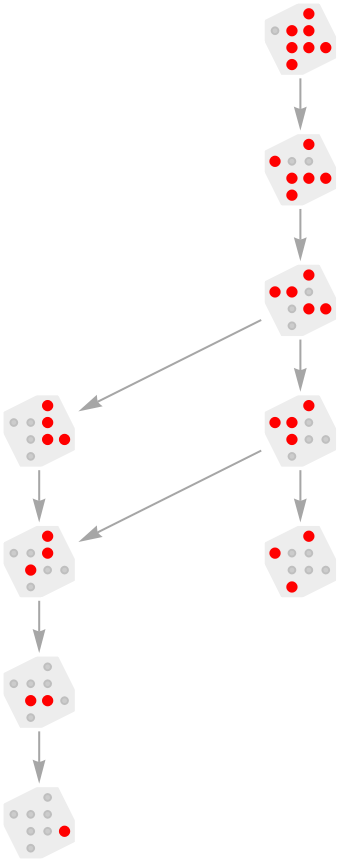
As I was looking at the multiway graphs of larger boards, I noticed that many of the board states were quite similar, just rotated or flipped, and I knew that if I could remove these duplicate boards it would make my graphs cleaner and easier to analyze, and game graphs can get very large very quickly, so anything that reduces size is important to allowing us to calculate more complicated games.
Notice how in this graph, just after the first move the two boards produced are transformations of each other
Notice how in this graph, just after the first move the two boards produced are transformations of each other
Out[]=
My first idea on how to delete these duplicate boards was to look at their images when put through the PegSolitaireGraphics function, which creates an image of the board state, but this turned out to be very computationally expensive and took a very long time which was unfortunate.
I created three functions which work together to generate a list of “unique” board states given a list of states based on their image data. These only work on square and cross boards due to the way triangular boards are generated visually.
I created three functions which work together to generate a list of “unique” board states given a list of states based on their image data. These only work on square and cross boards due to the way triangular boards are generated visually.
Due to the fact that I needed to rotate images, just using the == equality test didn’t work, as during image rotation artifacts were created in the image which made the image data not exactly the same, so I had to create my own function to test image similarity using the image difference of the images.
In[]:=
compareImg[img1_,img2_]:=If[Length[DominantColors[ImageDifference[ImageRotate[img1,90Degree],img2]]]==1||Length[DominantColors[ImageDifference[ImageRotate[img1,180Degree],img2]]]==1||Length[DominantColors[ImageDifference[ImageRotate[img1,270Degree],img2]]]==1||Length[DominantColors[ImageDifference[ImageReflect[img1],img2]]]==1||Length[DominantColors[ImageDifference[ImageReflect[img1,Left],img2]]]==1||Length[DominantColors[ImageDifference[ImageRotate[ImageReflect[img1],90Degree],img2]]]==1||Length[DominantColors[ImageDifference[ImageRotate[ImageReflect[img1],180Degree],img2]]]==1||Length[DominantColors[ImageDifference[ImageRotate[ImageReflect[img1],270Degree],img2]]]==1,True,False]
Next, I created a new multiway graph function which removed duplicate boards using the image comparison function, like I mentioned above, it’s quite slow due to the amount of image manipulation it’s doing.
This function works in a very similar way to the base multiway graph function, but after generating the board it contracts together the vertices which are the same when transformed.
As you can see below, the image checking function can create a simplified version of the larger graph.
Removing “Duplicate” Board States Using Matrix Transformations
Removing “Duplicate” Board States Using Matrix Transformations
I quickly realized that the image method of removing duplicate boards was not going to work, so I pivoted to using matrix transformations. Unfortunately this currently only works for square boards, as the matrix transformations for triangular and cross boards are not the same. This method is much faster than the image method which allows me to use it for larger boards without worrying about how long it will take.
Similarly to the way I implemented the image comparison functions, I have one function which compares two states and if they are the same, one function which takes in a board state and a list of unique boards and tests if the board is already represented, and a final function which creates a list of unique states from a list of all the states.
Similar to the previous implementation of my multiway graph function, this function only shows “unique” board states, but runs much faster due to the fact it utilizes matrix transformations. Unfortunately the draw back to this is that It only works on square boards, due to the way matrix transformations manipulate the lists of states. It again uses vertex contract to remove the duplicate boards, and since all the children of duplicate board states are also duplicates it makes it very easy to merge together the nodes.
Going back to the 3 by 3 board, you can see the difference in timing between the two methods of reducing boards, with the matrix checking method being ~8470 times faster for this board.
Generating All Possible Moves
Generating All Possible Moves
As I worked more with the multiway graph functions, I wanted there to be an easier way for me to create a list of all the possible moves in a board as I’d been doing it all manually, so I created a function which, given a board’s coordinate pair list, would output all possible moves.
As you can see making a move is just changing the board states from {0, 0, 1, 1,1,1,1,1} to {0,1, 0, 0,1,1,1,1}, each of the possible moves in a board is represented by a tuple which contains the “names” or indexes of each of the pegs which are in the move ex: {1,2,3}. In the multiway graph function, the iterator looks for the pattern 0,1,1 or 1,1,0 and converts that to 1,0,0 or 0,0,1.
To do this, I needed to be able to distinguish between triangle and square (or cross) boards, so I created a classifier function which could do this, and to create data for the neural network, I created a function which given a set of coordinates created a graph of what the board would look like .
I then created a set of functions which together create the move lists for all types of boards by mapping through all the pegs in the board. I had to separate between triangle and square boards due to the fact that while on square boards diagonal moves are not allowed, on triangular boards they are.
Manipulating Graphs
Manipulating Graphs
As my graphs got larger and more complicated, I wanted a way to zoom in on them so I could take a better look at nodes, so I created a crop graph function which shows specific vertexes based on how many pegs are on the board. Since in peg solitaire the board will only lose pegs, and only loses one peg per move, it was pretty simple to implement.
This manipulate lets you choose a max number of pins and minimum number of pins to show on the multiway graph. As you drag the max slider “up” you lower the max number of pins on each board that will be displayed and as you drag the min slider up you increase the minimum number of pins that will be shown on boards.
I also wanted a create another function which would let you manipulate the graphs in the x and y direction and also change the node size, as when you create larger graphs or zoom in on sections of graphs the distance between nodes can become very large, and this function allows you to squish the nodes closer together by manipulating their coordinate positions. It also allows you to change the size of the nodes, so that they’re not too small to see.
Analyzing 3 by 3 Boards
Analyzing 3 by 3 Boards
Below is a graphic which shows all the possible board states (up to transformation) which can be produced with different numbers of pegs missing, as you can see through the animation there is the same number of boards when there’s 1 hole and when there is 9, 2 and 7, 3 and 6, and 4 and 5, this is because the graphs are “inverses” of each other, the pegs become holes and the holes become pegs.
All Possible Multiway Graphs
All Possible Multiway Graphs
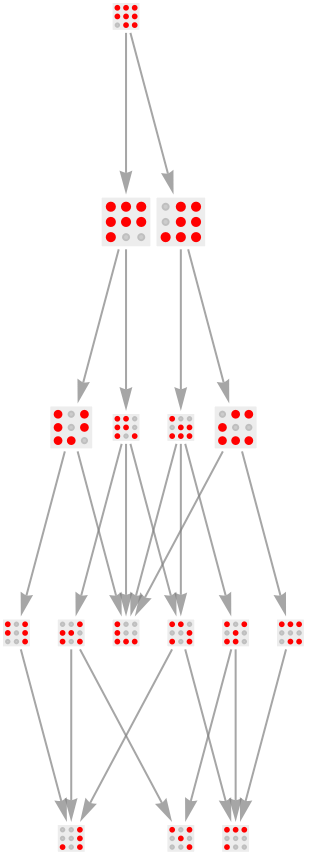
From each of these “starting boards” you can create a multiway graph, below you can see all the possible graphs that come from a 3 by 3 where there 2 or more moves. As you look from fewer nodes to more nodes, you can see how some multiway graphs can “fit” into each other. As in the graph of a board with only a few pegs remaining may be able to be seen in the bottom of a graph with a greater number of pegs.
Here is a list of all the possible board states that can lead to a solution, as you can see none of these board states are true starting boards, as a 3 by 3 board is unsolvable, but we may be able to use these graphs to analyze boards of larger sizes due to the fact that all three by three board possibilities are also moves that can be made on a sub-board larger board.
3 By 3 Boards with Holes
3 By 3 Boards with Holes
Next, I wanted to see adding “holes”, or spots where pegs can’t be, to the board would effect how the multiway graphs would be played out, and these boards can be used as sub-boards for non square boards, and looking at boards which are not square can show us new possibilities for moves that can help us solve more complex boards.
I had to create a new set of functions to find moves and also to create the multiway graph due to the fact that these boards had to be defined differently to be able to use PegSolitaireGraphics with them, as I created these boards by adding 3’s in place of spots where pegs would have been to make sure they would still work with matrix conversions. With these functions the multiway graph will also work to remove duplicates from cross boards as well as square boards. Unfortunately, it still won’t work for triangular boards due to the fact the coordinates for their pegs are not on a grid.
This version of my multiway graph function takes in a list of coordinates with their names (ex: {{1,1} -> 1, {1,2} -> 2, {1,3} -> 3}) due the way that the state list is written
All 3 by 3 boards with one blank space and one hole which leads to a multiway graph with more then 3 moves
Expanding 3 by 3’s to Larger Boards
Expanding 3 by 3’s to Larger Boards
I wanted to look at how the multiway graphs of previously unsolvable 3 by 3’s would look if expanded to larger board sizes, and seeing if there are some unsolvable 3 by 3’s that would be solvable on other boards.
I first tried 5 by 5’s for which I simply added an extra empty row / column on each side of the board state list to expand the board out, and below you can see a graphic of all the possible 3 by 3 boards (which don’t end in a solution) expanded out to a 5 by 5 board.
I first tried 5 by 5’s for which I simply added an extra empty row / column on each side of the board state list to expand the board out, and below you can see a graphic of all the possible 3 by 3 boards (which don’t end in a solution) expanded out to a 5 by 5 board.
Many of the smaller 5 by 5 boards don’t end in a solution due to the limited number of pegs, but some of the graphs quickly grow large because of the extra space given. In all of them you can look back and see the way that the three by three would have been played “with in” them in their graphs.
I then also wanted to test this idea on 4 by 4’s, which was a little more complicated due to the fact there were 4 different ways which a 4 by 4 could be positioned in, or “on” a 3 by 3 board. I created a function where you can specify which areas you want an extra row / column to be added, top or bottom and right or left, and a function which could work for all of those cases.
These four functions take a graph and if you want a row added on the top or bottom and a column added on the right or left, and using append and prepend, adds in rows of 0’s where needed.
For the rest of this essay, I’ll focus in on this 3 by 3 board with 3 pegs missing, and show it’s four possible 4 by 4 multiway graphs and it’s 5 by 5 graph.
Here is all the possible 4 by 4 boards and their multiway graphs, as you can see just adding in an extra row and column has already expanding the multiway graph quite a lot.
Here’s the multiway graph of the 5 by 5 board, which has expanded quite a bit from even the four by four boards shown above. As I looked at each of these graphs, I noticed that some of the boards looked quite similar, just with an extra row and column from the four by fours, and that as you follow the moves you can match up boards from the four by four’s to this larger graph.
Comparing 4 x 4 and 5 x 5 Boards
Comparing 4 x 4 and 5 x 5 Boards
As I looked at those graphs, I noticed that every possible 4 by 4 move is shown in the larger 5 by 5, and every move on a 3 by 3 board is also shown in it’s 4 by 4 and 5 by 5 graph. I wanted to prove this for sure, so I created a set of functions to prove this.
Similar to the three to four functions, these functions take in a 4 by 4 board and expand them to a 5 by 5 by taking in which row and column need to be expanded using Append and Prepend, so that they can be compared to the 5 by 5 board.
This function takes in a five by five graph and a four by four graph and where it needs to be expanded, and highlights the edges where moves possible are the same in both graphs using HighlightGraph.
Below you can choose a 4 by 4 board and see where on the 5 by 5 graph it is contained.
Conclusion
Conclusion
Even with just a 4 by 4 board, the number of different moves and board states is enormous and it only exponentially increases as the board size grows. In the future it would be interesting to be able to analyze triangular boards by understanding their matrix transformations, along with hexagonal boards which are also very common, and be able to simplify the multiway graphs of larger boards by using smaller boards, making it more possible to analyze full 5 by 5 and further boards, as using my current function it takes far too much computational power to even generate the full multiway graph of a 5 by 5 board. Along with this, there are also non traditional board shapes, such as boards with “holes” in the middle of them which would interesting to explore, and to find a way to develop the optimal strategy for different board types.
References
References
◼
(n.d.). Peg Solitaire. Wikipedia. Retrieved July 11, 2024, from https://en.wikipedia.org/wiki/Peg_solitaire
◼
Wolfram, S. (2022, June 8). Games and Puzzles as Multicomputational Systems. Stephen Wolfram Writings. Retrieved July 11, 2024, from https://writings.stephenwolfram.com/2022/06/games-and-puzzles-as-multicomputational-systems/
◼
Weisstein, Eric W. “(n.d.) Multiway Graph.” Retrieved July 11, 2024, From MathWorld--A Wolfram Web Resource. https://mathworld.wolfram.com/MultiwayGraph.html
Acknowledgements
Acknowledgements
Thank you to my mentor Adam Millar, who helped me with a lot of the math in this project and for being able to understand my diagrams of different boards, and to Logan Gilbert for helping me with much of the debugging and for his and Dugan Hammock helping me figure out the undocumented resource functions I was using.
CITE THIS NOTEBOOK
CITE THIS NOTEBOOK
Analyzing peg solitaire game boards using multiway graphs
by Anoushka Muchhal
Wolfram Community, STAFF PICKS, July 11, 2024
https://community.wolfram.com/groups/-/m/t/3215233
by Anoushka Muchhal
Wolfram Community, STAFF PICKS, July 11, 2024
https://community.wolfram.com/groups/-/m/t/3215233