Introduction
Introduction
Abstract
Abstract
Reddit is among the world’s most popular social media platforms, where users share content on forums called “subreddits” that garner “up-votes” and comments from viewers. By using posts from the 3rd most popular subreddit, r/funny, we will predict the scores of posts, a measurement of a post’s popularity calculated by the number of "upvotes" minus the number of "downvotes", from a multitude of factors including post title, thumbnail, and user author karma. Additionally, we will analyze the effects of combinations of these factors on post popularity to perhaps gain an insight into what dictates a “popular” Reddit post.
Inspiration
Inspiration
A few years ago, my friends and I were having an almost silly discussion over if it would be ever possible to predict which trend would go viral on social media after the current ones died down. Being "ambitious" high-schoolers, but not having any idea on what to do this research on, we attempted to create a model that did this with Instagram posts. Expectedly, this model was wildly inaccurate and unsuccessful and soon most of us just forgot about it. However, the idea of analyzing and predicting social media popularity still intrigued me, and I was delighted to explore this topic at Wolfram's summer camp.
Data Extraction/Processing
Data Extraction/Processing
The first step of getting Reddit data was using Wolfram's ServiceConnect method to access the API.
ServiceConnect function:
In[]:=
reddit = ServiceConnect["Reddit"]
Out[]=
ServiceObject

I then prompted the user to ask for a subreddit to train the model on. To access the posts themselves, I used the ServiceConnect object and retrieved the 1000 most recent posts on the subreddit on each of the following pages: "New", "Top", "Hot", and "Rising".
Getting posts:
In[]:=
in = Input["Enter Subreddit Name without the r/ part"];GrabPosts[inp_,type_String]:=reddit["SubredditPosts","Subreddit"->ToString[inp],"ShowThumbnails"->True,MaxItems->1000,"SortBy"->type]["Posts"][All,{"Title","CreationDate","Author","Score","Ups","Downs","Thumbnail","Selftext","CommentsCount"}];newPosts=GrabPosts[in, "New"];topPosts = GrabPosts[in, "Top"];hotPosts = GrabPosts[in, "Hot"];trendingPosts = GrabPosts[in, "Rising"];
Sample of posts:
Out[]=





◼
My choice to include an input field for the subreddit was because I wanted this model to be applicable to all subreddits, not just r/funny
◼
An issue was reddit not being able to return 1000 posts due to an API limitation that only allowed recent posts to be retrieved.
Since many of the most popular posts could be featured on more than one of these pages or reposted by other users, I combined all the posts I gathered and used a combination of Wolfram’s DeleteDuplicates and functions to only take the first occurrence of each Title. This way, even re-posts by different users would be removed from the gathered data. I also kept track of the length of the posts, and continued adding new posts to my older dataset. The model trained in this essay was done on around 2000 posts after duplicates were deleted.
Since many of the most popular posts could be featured on more than one of these pages or reposted by other users, I combined all the posts I gathered and used a combination of Wolfram’s DeleteDuplicates and functions to only take the first occurrence of each Title. This way, even re-posts by different users would be removed from the gathered data. I also kept track of the length of the posts, and continued adding new posts to my older dataset. The model trained in this essay was done on around 2000 posts after duplicates were deleted.
Deleting Duplicates
In[]:=
posts = Which[Length[posts]>1,Join[ posts, newPosts,topPosts, hotPosts, trendingPosts], Length[posts]==1, Join[ newPosts,topPosts, hotPosts, trendingPosts]];titles = StringReplace[Normal[posts[All, "Title"]],Except[{WordCharacter, " ", PunctuationCharacter, DigitCharacter}]->""];oneofeach = DeleteDuplicates[StringReplace[Normal[posts[All, "Title"]],Except[{WordCharacter, " ", PunctuationCharacter, DigitCharacter}]->""]];keepRows = Table[Flatten[Position[titles, a]][[1]],{a, oneofeach}];posts = posts[keepRows];posts = RandomSample[posts];num = Length[posts];
◼
StringReplace and Except were used to remove any emoji from titles, as they couldn't be processed into lists
◼
RandomSample was used to ensure the posts would be evenly distributed when split into sets
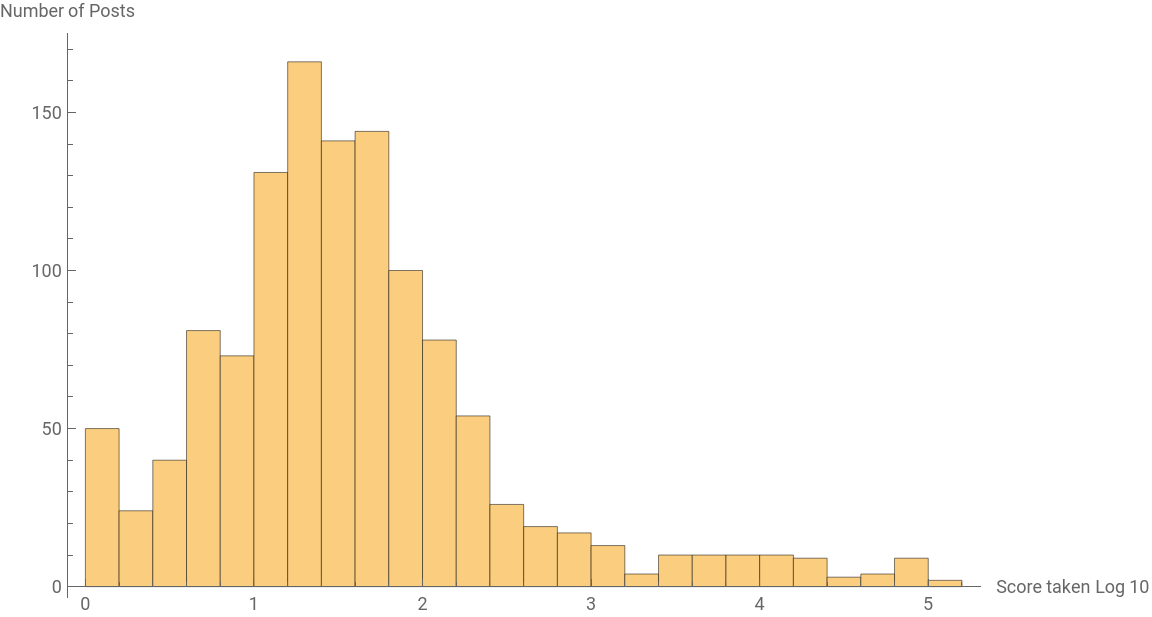
Code for generating a histogram of post scores taken log 10:
logpostscores=Log[10,Normal[posts[All,"Score"]]];Histogramlogpostscores,
Out[]=
Splitting and Preparing the Data
Splitting and Preparing the Data
My first goal when splitting the data was to classify each post as "Popular" or "Not Popular". Using Wolfram's AbsoluteTime and CurrentDate methods, I determined how long ago each post had been made as well as how much score it averaged an hour. I chose to use a static system to mark posts as "Popular". For posts that were over 12 hours old, I marked it as "Popular" if it had a score of at least 500 and "Not Popular" otherwise. Posts less than 12 hours old were marked as "Popular" if they averaged at least 40 score per hour.
Classifying posts' popularity:
In[]:=
date = AbsoluteTime[CurrentDate[]];allScores = Normal[posts[All, "Score"]];postHourDifferences = Table[(Abs[date-AbsoluteTime[i]]/3600), {i, Normal[posts[All, "CreationDate"]]}];scorePerHour = Table[(allScores[[k]]/postHourDifferences[[k]]),{k, Range[1, Length[allScores]]}];allPopularities = Table[Which[postHourDifferences[[j]]>=12, Which[allScores[[j]]>=500, "Popular", allScores[[j]]<500, "Not Popular"], postHourDifferences[[j]]<12, Which[scorePerHour[[j]]>=40, "Popular", scorePerHour[[j]]<40, "Not Popular"]], {j, Range[1, Length[allScores]]} ];
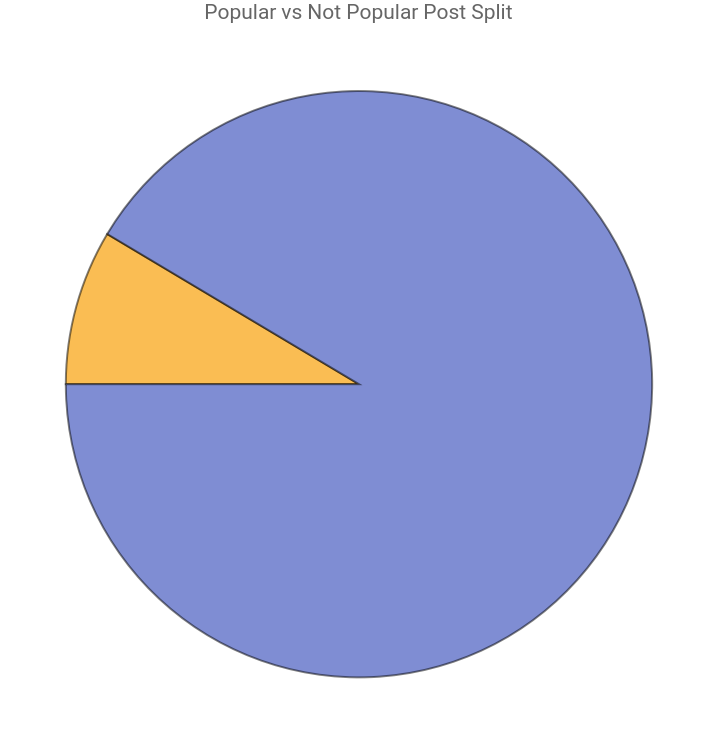
Code for generating a Pie Chart of how posts were split:
In[]:=
PieChart[{(Count[allPopularities,"Popular"]),(Count[allPopularities,"Not Popular"])},ChartLegends->{"Popular","Not Popular"},PlotLabel->"Popular vs Not Popular Post Split"]
Out[]=


For each post, I collected the "LinkKarma", more commonly known as Author Karma, of every author, which is the net score of every one of their posts, not including comments or badges. For authors who had deleted their account or somehow did not have their Post Karma available, I put a 0 for this value
Getting each author's Post Karma:
In[]:=
authorKarma = Replace[Table[reddit["UserData","User"ToString[author]]["LinkKarma"],{author,Normal[posts[1;;num,"Author"]]}],Except[_?NumericQ]0,{1}];
Now came the part of splitting the data into training, validation, and testing sets. I used an approximately 80-10-10 split for each respective set using Wolfram's Floor function and the variable containing the number of posts.
Splitting the posts:
In[]:=
trainingTitles =Normal[posts[1;;Floor[num*0.8], "Title"]];trainingScores = Normal[posts[1;;Floor[num*0.8], "Score"]];trainingThumbnails = Normal[posts[1;;Floor[num*0.8], "Thumbnail"]];trainingText = Normal[posts[1;;Floor[num*0.8], "Selftext"]];trainingAuthorKarma = authorKarma[[1;;Floor[num*0.8]]];trainingPopularity = allPopularities[[1;;Floor[num*0.8]]];validTitles =Normal[posts[Floor[(num*0.8+1)];;Floor[num*0.9], "Title"]];validScores = Normal[posts[Floor[(num*0.8+1)];;Floor[num*0.9], "Score"]];validThumbnails = Normal[posts[Floor[(num*0.8+1)];;Floor[num*0.9], "Thumbnail"]];validText = Normal[posts[Floor[(num*0.8+1)];;Floor[num*0.9], "Selftext"]];validAuthorKarma = authorKarma[[Floor[(num*0.8+1)];;Floor[num*0.9]]];validPopularity = allPopularities[[Floor[(num*0.8+1)];;Floor[num*0.9]]];testingTitles =Normal[posts[Floor[(num*0.9+1)];;num, "Title"]];testingScores = Normal[posts[Floor[(num*0.9+1)];;num, "Score"]];testingThumbnails = Normal[posts[Floor[(num*0.9+1)];;num, "Thumbnail"]];testingText = Normal[posts[Floor[(num*0.9+1)];;num, "Selftext"]];testingAuthorKarma = authorKarma[[Floor[(num*0.9+1)];;num]];testingPopularity = allPopularities[[Floor[(num*0.9+1)];;num]];
Data Analysis
Data Analysis
Before training the feature extractor and predictor, I wanted to visually compare the data of some of the posts marked as "Popular" with those marked as "Not Popular":
Comparing scores of the two types of posts:
Comparing scores of the two types of posts:
◼
As expected, the scores of "Popular" posts were significantly greater than those of "Not Popular" ones
◼
The “Popular” distribution was quite right skewed due to the nature of some posts being greatly popular
◼
The shape of the "Not Popular" distribution can be attributed to a large number of posts having very low scores and mostly ignored
Histograms comparing Post Karma to Popularity:
Histograms comparing Post Karma to Popularity:
Histograms comparing Post Karma to Popularity:
◼
Surprisingly, there was no significant difference in the distribution of Post Karma for users whose posts were popular and those who weren't
◼
Interestingly, there were users with large amounts of Author Karma with Non-Popular posts.
Word Clouds
Word Clouds
Word Clouds
Word Cloud for Popular titles:
Word Cloud for Non-Popular Titles
◼
Mostly just an interesting model to visualize what comprises the titles of each type of post
◼
I was surprised to see "dog" in the Non-Popular WordCloud but not in Popular one
◼
“Connor” and “McGregor” being in the popular WordCloud suggest that recent events do find themselves in many popular posts
Now that we've looked at the data itself, it's time to try to predict reddit popularity!
Now that we've looked at the data itself, it's time to try to predict reddit popularity!
Training the Models
Training the Models
Since I planned to train my predictor on input that contained a variety of data types (pictures, words, and numbers), I used a feature extractor to convert all my data into a vector with numerical input.
Feature Extraction:
Once I had done features extraction on the training, valid, and testing data sets, I created each respective set for the predictor. Since I planned on using each method with the Predict function as well as the "Self-Normalizing Net for Numeric Data" available in Wolfram's data repository, I created a standardized version of each data set to feed into this model.
Forming and standardizing the predictor data
To train the predictor, I used the "ADAM" method and 250 training rounds:
Training the “Self-Normalizing Net for Numeric Data” Regression Model
Model Results
Model Results
I first retrieved tested the Standard deviations of all the models in the Predict function.
Standard Deviations of Predict functions
“Self-Normalizing Net for Numeric Data” Regression Model Standard Deviation
Since the Self-Normalizing Net returned the smallest standard value out of all the other methods, I used it to create error Residual Plots analyzing the predictor's accuracy on the testing set.
Residual Plot
Overall, the model was decently accurate, with larger predictions becoming increasingly inaccurate. I wasn't expecting the model to be too accurate, but it was quite decent on posts with a smaller score. This is likely because most of the posts fed into the model had scores around 0 to 400 and due to the small training set size, the model likely got accustomed to predicting these values for all posts.
Interactive Model
Interactive Model
So here's a little fun part. Below is code that takes in input for a reddit post and feeds it into the predictor. The model will try to predict the score of this theoretical post: (The prediction will show up after you've submitted the form)
Run this code and click the link produced:
Conclusion
Conclusion
◼
My project has two main parts: one focused on analyzing reddit post data and the other is training a machine learning model to predict the scores of reddit posts
◼
Successes
◼
I was able to classify and compare the properties of "Popular" and "Not Popular" reddit posts
◼
My model worked to a certain extent and there are many ways it could potentially be improved upon, which is pretty exciting
◼
Most importantly, I learned a lot about what makes a post popular
◼
Improvements
◼
Foremost, future predicting models would benefit greatly from a larger dataset.
◼
Wolfram's ServiceConnect provided many capabilities for this project, but it's limit on being able to access recent posts limited me to a couple thousand unique posts.
◼
A better, more specific feature extraction tool could be used on each type of input data
◼
The scores of all posts could be interpolated to a fixed time before being fed into the model
◼
Possible extensions
◼
Analyze the sentiment of the comments and titles of Popular vs Non-Popular posts
◼
Predict the sentiment of posts
◼
Identify the most common objects of popular posts' thumbnails
◼
Extend the model to predict the popularity of posts in a certain year
◼
For example, a post's popularity in 2017 could be different than its popularity now
◼
Acknowledgements
◼
I would like to give a huge thanks to Zach Shelton, my mentor, for enthusiastically guiding me through every aspect of this project and always giving me more ideas to work on. I'd also like to thank all the students, mentors, TAs, and the director Rory Foulger for making this project possible and just creating an amazing camp experience.