The present study investigates the preferred conformations and energies of three important saccharides – glucuronic acid, mannose and xylose, which are the constituents of the polysaccharide capsule of Cryptococcus neoformans. The potential energy surfaces of these molecules have been explored using Merck Molecular Force Field (MMFF) in order to better understand their structural features and stability. For each sugar there were several conformers generated, examined for geometric optimization and determination of low-energy configurations. Our findings contribute to the knowledge on the basic structures responsible for capsule formation in C. neoformans. These conformational preferences identified may be crucial in polysaccharide assembly and interaction with host immune systems. The present research paves way for further studies aimed at investigating relationships between structure-function association within the capsule and target sites for anti-cryptococcal therapeutics.
Introduction
Introduction
Cryptococcus neoformans is a pathogenic yeast that endangers immunocompromised individuals. One of the most notable characteristics of Cryptococcus neoformans is the existence of its complex polysaccharide capsule, which encircles its cell wall. This capsule serves as a major virulence determinant and aids in evading host’s defences by the fungus. The capsular polysaccharide of C. neoformans is actually made up of several saccharides: glucuronic acid, xylose and mannose.
Composition of the Polysaccharide Shell
Composition of the Polysaccharide Shell
Glucuronic acid is a uronic acid derivative of glucose which is particularly interesting because of its molecular flexibility. One reason for this is due to OH functional groups that can rotate around the C-O single bond. xylose being a five-carbon sugar plays an important role in the antigenic properties of the capsule which makes up capsular polysaccharide. Mannose is a six-carbon sugar and another building block for the capsular polysaccharide. The combination of different glucuronic acids, xyloses and mannoses results to unique characteristics within C. neoformans’ capsule such as defending yeast against host immune response and virulence factors as well. The presence of these diverse sugar components allows for a variety of intramolecular and intermolecular interactions. For instance, they can form hydrogen bonds with other parts of the same molecule, with neighboring polysaccharide chains, or with water molecules in the surrounding aqueous environment. The combination of glucuronic acid, xylose, and mannose residues contributes to the unique properties of the C. neoformans capsule, including its ability to shield the yeast from host immune responses and its role in virulence.
Aim
Aim
The objective of this investigation is to explore conformations in order to determine how different positions of hydroxyl groups and the carboxylic acid react with energy in glucuronic acid molecule. This experiment also incorporates xylose and mannose hence offering a more holistic view on the structure regarding capsular polysaccharide structure. The main goal is to explore the potential energy surface (PES) using Merck molecular force fields (MMFF) for the each of the saccharides to locate the lowest energy arrangement of the OH functional groups. MMFF is a family of chemistry force fields based on the MM3 force field which is not optimized for one use, but performs well for a wide range of organic chemistry calculations. It would be important to study conformational preferences and energetics for these sugar constituents; which can help us understand how C. neoformans forms it into a capsule as well as overall functionality for targeting it using new approaches that seek to interfere with such vital virulence factor.
Glucuronic Acid
Glucuronic Acid
Data Preparation and Setup
Data Preparation and Setup
To compute the atom coordinates of D-glucuronic acid, we use the MoleculeModify function:
In[]:=
dGlucuronicAcid=MoleculeModifyMolecule,{"ComputeAtomCoordinates"}
Out[]=
Molecule


To plot glucuronic acid in three dimensions, we use the MoleculePlot3D function:
In[]:=
MoleculePlot3D[dGlucuronicAcid]
Out[]=

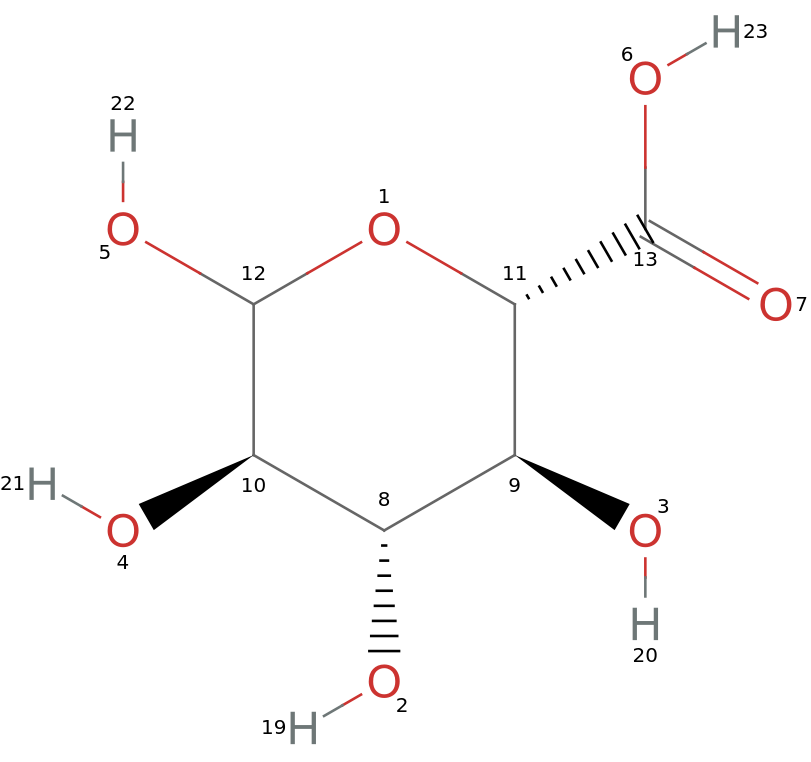
For simplifying the manipulations, functions are created and used to map the atom indices to the specific bonds of interests in 2D as well as 3D to precisely control the torsion angles.
A function is created to visualize molecules in two dimensions and display the atom index of each atom in the molecule using MoleculePlot:
In[]:=
indexMoleculePlot[mol_]:=MoleculePlot[mol,AtomLabels->"AtomIndex"]
Apply the indexMoleculePlot[mol_] to D-glucuronic acid:
In[]:=
indexMoleculePlot[dGlucuronicAcid]
Out[]=
Another function is created to visualize molecules in three dimensions and, similarly, display the atom index of each atom using MoleculePlot3D:
In[]:=
indexMoleculePlot3D[mol_]:=MoleculePlot3D[mol,AtomLabels->"AtomIndex"]
Apply the indexMoleculePlot3D[mol_] to D-glucuronic acid:
In[]:=
indexMoleculePlot3D[dGlucuronicAcid]
Out[]=

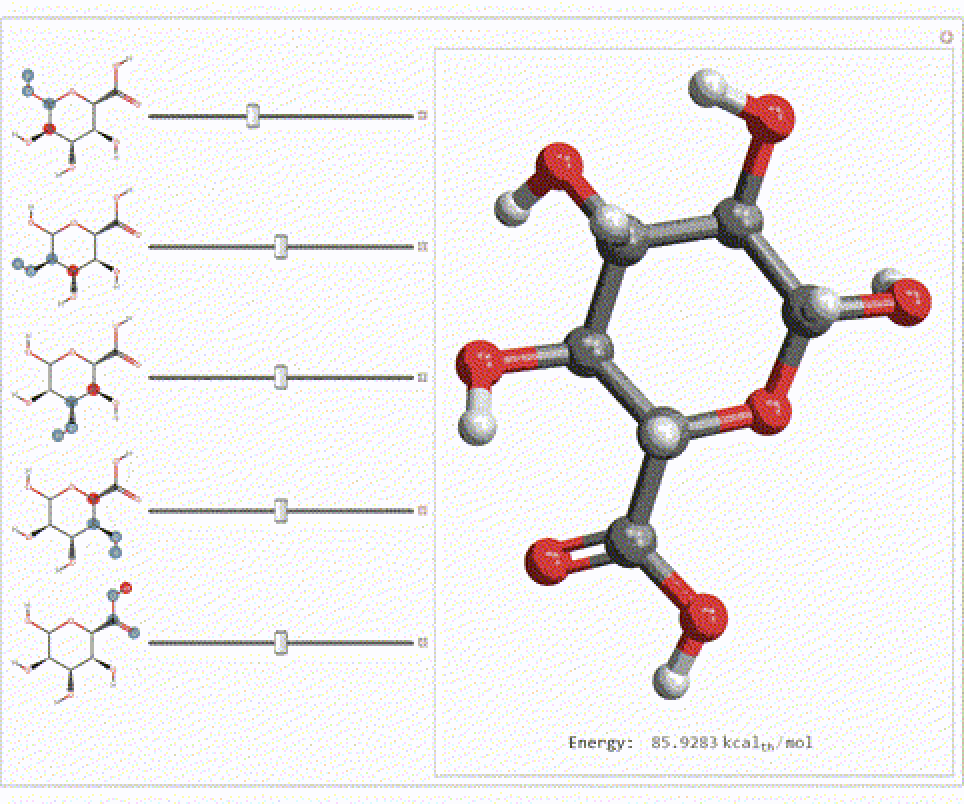
The specific torsion angles are then modified to study their effect on molecular conformation and energy as these torsion angles influence the molecule’s 3D conformation, which in turn affects its energy and interactions. Five torsion angles within the glucuronic acid molecule are defined and we can manipulating these angles interactively to observe their effects on the molecular conformation and the resulting energy.
The MoleculePlot3D function provides a 3D visualization of the modified molecule, while MoleculeValue calculates its energy. The MoleculePlot function is used to plot the atoms whose torsion angles is to be modified to give us a clear visual representation. The Manipulate function puts all of this together and allows us to dynamically change the torsion angles:
In[]:=
glucManipulate=With[{torsionOH={{10,12,5,22},{8,10,4,21},{9,8,2,19},{11,9,3,20},{23,6,13,7}}},Manipulate[Module[{moleculeModified},moleculeModified=MoleculeModify[dGlucuronicAcid,{"SetTorsionAngle",Thread[torsionOH->{x1,x2,x3,x4,x5}]}];Column[{MoleculePlot3D[moleculeModified,ImageSize->Medium],Spacer[0],Row[{"Energy: ",MoleculeValue[moleculeModified,"MMFFEnergy"]}]},Alignment->Center]],{{x1,0,MoleculePlot[dGlucuronicAcid,torsionOH[[1]],ImageSize->Tiny]},-180,180},{{x2,0,MoleculePlot[dGlucuronicAcid,torsionOH[[2]],ImageSize->Tiny]},-180,180},{{x3,0,MoleculePlot[dGlucuronicAcid,torsionOH[[3]],ImageSize->Tiny]},-180,180},{{x4,0,MoleculePlot[dGlucuronicAcid,torsionOH[[4]],ImageSize->Tiny]},-180,180},{{x5,0,MoleculePlot[dGlucuronicAcid,torsionOH[[5]],ImageSize->Tiny]},-180,180},ControlPlacement->Left,SaveDefinitions->True]];
In[]:=
Export[FileNameJoin[{NotebookDirectory[],"glucManipulate.gif"}],glucManipulate]
Out[]=
D:\WSRP_Project\10th July\glucManipulate.gif
In[]:=
AnimatedImage[Import[NotebookDirectory[]<>"glucManipulate.gif"],FrameRate->4]
Out[]=
Generating and Visualizing Conformers
Generating and Visualizing Conformers
A molecule can have a variety of different spatial arrangements. To do this, various random conformers, which are isomers of a molecule that differ from another isomer by the rotation of a single bond in the molecule, are generated. Each of the conformers represent a unique conformation with a given energy level. The process enables the mapping of potential energy surface (PES). By doing so, it becomes possible to tell which states of lowest energy are characteristic of the molecule.
The MoleculeModify function is used again to generate 700 conformers of glucuronic acid:
In[]:=
(conformers=MoleculeModify[dGlucuronicAcid,{"GenerateConformers",700}])//Short[#,.5]&
Out[]//Short=
Molecule,Molecule,Molecule,Molecule,692,Molecule,Molecule,Molecule,Molecule

Another way to understand the data derived from random structures is by visualizing such structures as histograms. This visualization allows us immediate and intuitive comparison of different conformations.
MoleculePlot3D is used to plot the generated conformers on top of each other:
A histogram is plotted using the Histogram function with the energy levels on the X-axis and the number of conformers on the Y-axis. The MoleculeValue function is also used in this case to extract energy values from the conformers:
For optimizing molecular structures, atomic coordinates are adjusted to minimize the energy of a molecule and determine its stable conformations. Optimization is fundamentally to identify the lowest possible energy states that are likely to be observed naturally. The energies of their unoptimized versus optimized conformers were reduced after optimization rather than before optimization, which underscores the importance of finding stable configurations. In such a case, a high-energy or unstable conformation would not be important and it should therefore be removed so as to leave behind the low-energy conformations only. Such structural optimizations can enable physical and chemical properties to serve as better tools for examining a given molecule.
Once again, the MoleculeModify function nested within the Map function is used to adjust the atom coordinates of D-glucuronic acid:
The energy distribution of these optimized conformers is visualized using histograms.
Histogram function used:
Following this step, particular torsion angles are extracted from optimized conformers in order to analyze how these angles relate with molecular energy. The findings will then be used together.
The atom indices of the torsion angles to be calculated are stored in a matrix:
The torsion angles are calculated from the above data:
As demonstrated above MoleculeValue is used to extract MMFF energies:
MapThread is used to combine the torsion angles and the associated energy levels. It is also further used to combine this matrix with the optimized molecules:
Further, we create 3D plots of the optimized molecule and combine them using the above mentioned functions:
The minimum and maximum energy values among the optimized conformers are calculated using the MinMax function of the 6th column of the matrix:
Selecting and Analyzing Low-Energy Conformers
Selecting and Analyzing Low-Energy Conformers
Conformers are selected within a specific energy range to focus on the most stable structures. Selecting conformers with energies between 66 and 67 thermochemical kilocalories/mole narrows down the dataset to the most relevant structures.
The Select function is used to filter through the conformers and the length is displayed:
Extract the molecules from the 8th column of the matrix of low energy conformers:
Next, the dihedral angles of a select group of atoms are computed and compared to make sure the orientation of the hydrogens boded to the carbons in the cyclic chain is right.
The dihedral angles are calculated by:
The dihedral angle range is defined by and must fall within this range:
If the dihedral angle falls outside of the range, it is removed while if it falls within the range if it is sorted aside and kept for further calculation.
The number of appropriate conformers is calculated using the Length function:
The plots for the filtered molecules are given by:
The final dataset is given by a transpose of filteredMolecules and plots generated above using the Transpose function:
The MMFF energies are calculated of datasetFinal:
The D-glucuronic acid molecule with the minimum energy level is calculated and a 3D molecule plot is created. The minimum energy value of the most stable conformer of glucuronic acid is now calculated.
This is given by the Min function:
The next step is to calculate and plot the energy changes for specific torsion angle by defining functions to calculate energy changes for specific torsion angles and create plots to understand how torsion angles change and predict the most stable conformations.
Plotting of Energy Values with Respect to Torsion Angles
Plotting of Energy Values with Respect to Torsion Angles
The calcEnergy function calculates the energy of the molecule for a given torsion angle, while the generatePlot function generates a plot of energy versus torsion angle using the Module function and plotting using the ListPlot function:
The plots relating to each of the five torsion angles are plotted using the generatePlot function:
These plots illustrate the energy changes associated with each torsion angle, helping identify the most stable conformations.
Mannose
Mannose
Data Preparation and Setup
Data Preparation and Setup
Having completed the exploration of the potential energy surface (PES) of D-glucuronic acid, the same approach can be used for mannose.
MoleculeModify function to compute atom coordinates:
MoleculePlot3D function to plot Mannose in 3D:
Apply the indexMoleculePlot[mol_] to mannose:
Apply the indexMoleculePlot3D[mol_] to mannose:
Manipulate function to dynamically change the torsion angles:
Generating and Visualizing Conformers
Generating and Visualizing Conformers
MoleculeModify function is used to generate 700 conformers of mannose:
MoleculePlot3D is used to plot the generated conformers on top of each other:
Histogram function to plot unoptimized MMFF energy values:
Optimize the conformers using MoleculeModify:
Plot optimized conformers:
Now, the atom indices of the torsion angles are stored in a variable and the torsion angles are calculated. MoleculeValue is then used to extract MMFF energies and the torsion angles, associated energy levels and optimized molecules are combined:
The 3D plots of the optimized molecule are combined by:
The minimum and maximum energy values of the optimized conformers is calculated:
Selecting and Analyzing Low-Energy Conformers
Selecting and Analyzing Low-Energy Conformers
The Select function is used to filter through the conformers and the length is displayed:
Extract the molecules:
The dihedral angles are calculated by:
The dihedral angle range is defined by and must fall within this range:
The final dataset is prepared:
The mannose molecule with the minimum energy level is calculated and a 3D molecule plot is created:
Plotting of Energy Values with Respect to Torsion Angles
Plotting of Energy Values with Respect to Torsion Angles
Generate plots of energy versus torsion angle in D-mannose:
Xylose
Xylose
Data Preparation and Setup
Data Preparation and Setup
The same approach is now applied to xylose.
MoleculeModify function to compute atom coordinates:
MoleculePlot3D function to plot xylose in 3D:
Apply the indexMoleculePlot[mol_] to xylose:
Apply the indexMoleculePlot3D[mol_] to xylose:
Manipulate function to dynamically change the torsion angles:
Generating and Visualizing Conformers
Generating and Visualizing Conformers
MoleculeModify function is used to generate 700 conformers of xylose:
MoleculePlot3D is used to plot the generated conformers on top of each other:
Histogram function to plot unoptimized MMFF energy values:
Optimize the conformers using MoleculeModify:
Plot optimized conformers:
Now, the atom indices of the torsion angles are stored in a variable and the torsion angles are calculated. MoleculeValue is then used to extract MMFF energies and the torsion angles, associated energy levels and optimized molecules are combined:
The 3D plots of the optimized molecule are combined by:
The minimum and maximum energy values of the optimized conformers is calculated:
Selecting and Analyzing Low-Energy Conformers
Selecting and Analyzing Low-Energy Conformers
The Select function is used to filter through the conformers and the length is displayed:
Extract the molecules:
The dihedral angles are calculated by:
The dihedral angle range is defined and must fall within this range:
The final dataset is prepared:
The xylose molecule with the minimum energy level is calculated and a 3D molecule plot is created:
Plotting of Energy Values with Respect to Torsion Angles
Plotting of Energy Values with Respect to Torsion Angles
Generate plots of energy versus torsion angle in xylose:
Conclusion
Conclusion
The current investigation looked at the potential energy surface (PES) of glucuronic acid, mannose and xylose which are among the three saccharides that make up the capsular polysaccharide of Cryptococcus neoformans. We were able to learn about their structures and stability through MMFF force field calculations on these molecules’ potential energy surfaces. For each sugar molecule that was studied, many conformers were generated and analyzed. Structures of each of them were optimized while low-energy geometries were identified. The complexity of the connections between molecular geometry and stability is shown in the energy landscapes resulting from torsion angle manipulations. This study showed that there are stable conformers for glucuronic acid, mannose and xylose whose energies can be explained by changes in specific torsion angles within the molecule. As a result, these findings provide insight into molecular architecture underlying C. neoformans capsule development and functionality as well as conformational preferences that may be important in polysaccharide assembly or interaction with the host’s immune system.
Future Directions
Future Directions
Studying how these saccharides conform to different solvents from water and others that are relevant for biological system is more realistic. This means that to understand the behavior of these saccharides, their interactions with solvent must be established through molecular dynamics simulations with explicit water molecules. Another possible research direction is investigating how these saccharides bind to immune system components or possible drug molecules by first using the stable ones. The other option would be finding table conformational energy landscapes of similar carbohydrates to facilitate later investigations. We can also do a similar analysis on capsular polysaccharides from other pathogenic fungi. Whether this assumption is true or false will determine if any shared characters exist between several species. In addition, more accurate geometries and energetics could be obtained through density functional theory (DFT) calculations which could possibly reveal some subtle electronic effects affecting the conformational preferences. It would work best therefore if we employed highly accurate methods like MP2 or CCSD(T) in determining the energies of important conformers so as we may have benchmark data for method validation.
Acknowledgements
Acknowledgements
I would like to thank my mentor, Jason Sonnenberg, for their mentorship and Gracen Gerbig from Johns Hopkins Bloomberg School of Public Health for introducing me to this effort in biochemistry. I would also like to extend my gratitude to my teaching assistant, Alexander Do, for his support.
References
References
CITE THIS NOTEBOOK
CITE THIS NOTEBOOK
Analyzing polysaccharide bonding in Cryptococcus neoformans
by Sindhoora Raja
Wolfram Community, STAFF PICKS, July 11, 2024
https://community.wolfram.com/groups/-/m/t/3214184
by Sindhoora Raja
Wolfram Community, STAFF PICKS, July 11, 2024
https://community.wolfram.com/groups/-/m/t/3214184