Response to a tracer input of three continuous stirred-tank reactors in series
Authors: Housam Binous and Ahmed Bellagi
Response to a tracer input of three continuous stirred-tank reactors in series
Authors: Housam Binous and Ahmed Bellagi
Authors: Housam Binous and Ahmed Bellagi
Reference :1 - Mejri, S, Binous, H, Mahgoub, K, Bellagi, A. A model parameter estimation method using Mathematica© applied to transient chemical engineering processes. Comput Appl Eng Educ. 2018; 26 : 1405– 1421.
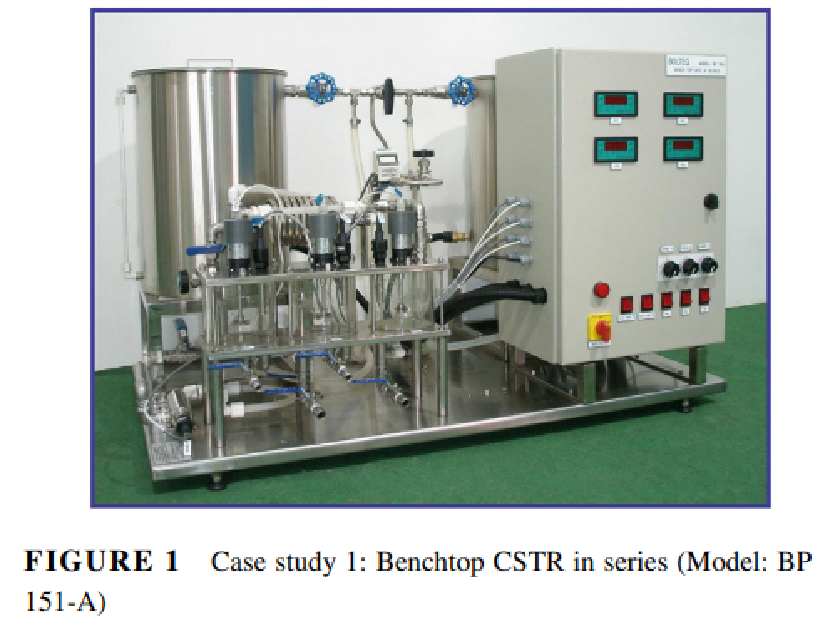
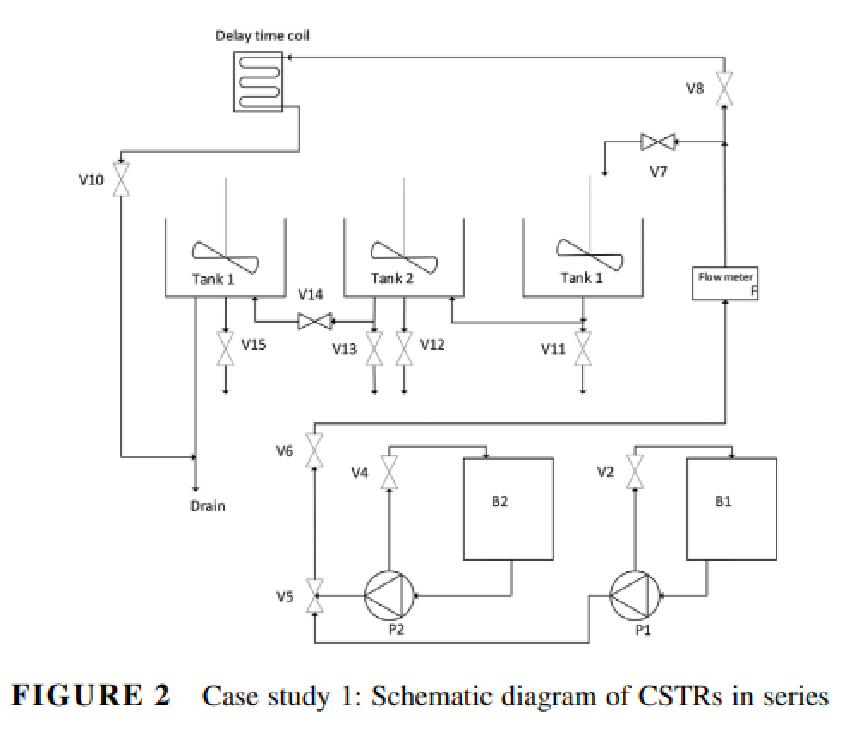
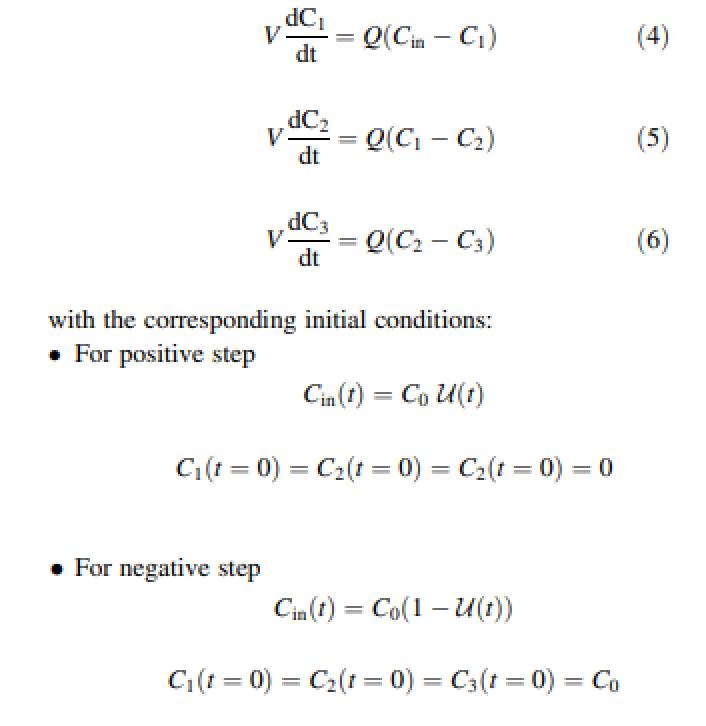
Governing equations are the following (see Ref. 1) :Experimental protocol: When a positive step change is applied, pump P-2 is switched on and the inlet valve V5 is switched so that the salt solution from reservoir B2 mixes with the water stream feeding the reactors. The conductivity versus time data in each tank is then recorded until the conductivities in all three tanks become constant. The negative step test then follows: the inlet valve V5 is switched back to the de-ionized water reservoir and the conductivity versus time data is recorded again until the conductivity in each tank reached nearly zero.
calibration data performed by laboratory technician before experiment for the three conductivity sensors
calibration data performed by laboratory technician before experiment for the three conductivity sensors
In[]:=
salt={0,1,2,2.5`,3,3.5`,4,4.5`,5,5.5`};q101={0,1.73`,3.33`,4.17`,4.88`,5.72`,6.39`,7.22`,7.87`,8.7`};q102={0,1.89`,3.58`,4.46`,5.22`,6.1`,6.81`,7.7`,8.37`,9.24`};q103={0,1.85`,3.62`,4.57`,5.33`,6.26`,6.98`,7.91`,8.6`,9.52`};cal1=Interpolation[Transpose[{q101,salt}],InterpolationOrder1];cal2=Interpolation[Transpose[{q102,salt}],InterpolationOrder1];cal3=Interpolation[Transpose[{q103,salt}],InterpolationOrder1];
In[]:=
ListPlot[{Transpose[{q101,salt}],Transpose[{q102,salt}],Transpose[{q103,salt}]},FrameTrue,GridLinesAutomatic,AspectRatio1,ImageSize400{1,1},FrameLabel{Style["Conductivity (Siemens/cm)",14],Style["salt concentration (g/l)",14]},PlotStyle{{Thick,PointSize[0.0175]},{Thick,PointSize[0.0175]},{Thick,PointSize[0.0175]}},PlotLegends{Style["sensor 1"],Style["sensor 2"],Style["sensor 3"]}]
Raw data collected by students during experiments for a positive step and a negative step
Raw data collected by students during experiments for a positive step and a negative step
plot of collected data for the positive step (from time 0 to 1800)
The concentration of NaCl at the reactor inlet in the positive step experiment changes abruptly from zero to C0 = 4.5 g/L.
plot of collected data for the positive step (from time 0 to 1800)
The concentration of NaCl at the reactor inlet in the positive step experiment changes abruptly from zero to C0 = 4.5 g/L.
The concentration of NaCl at the reactor inlet in the positive step experiment changes abruptly from zero to C0 = 4.5 g/L.
plot of collected data for the negative step (from time 2100 to 4000)
The concentration of NaCl at the reactor inlet in the negative step experiment changes abruptly from C0 = 4.5 g/L to zero.
plot of collected data for the negative step (from time 2100 to 4000)
The concentration of NaCl at the reactor inlet in the negative step experiment changes abruptly from C0 = 4.5 g/L to zero.
The concentration of NaCl at the reactor inlet in the negative step experiment changes abruptly from C0 = 4.5 g/L to zero.
model for the positive step
model for the positive step
Plot of residuals.
Notice that they are (1) small in magnitude and (2) randomly dispersed around the horizontal axis.
Plot of residuals.
Notice that they are (1) small in magnitude and (2) randomly dispersed around the horizontal axis.
Notice that they are (1) small in magnitude and (2) randomly dispersed around the horizontal axis.
model for the negative step
model for the negative step