This work explores various statistical and mathematical techniques for analyzing and representing the distributions of shallow multi-layer perceptrons with two hidden layers and a width of five. The fixed architecture adheres to the universal approximation property as proven by Guliyev and Ismailov [2]. To assess the potential of common activation functions, we have conducted a descriptive and comparative analysis of their functional spaces. We start by examining the basic statistics and additionally provide empirical estimates of the first four moments. A significant portion of the study focuses on the Karhunen-Loève Expansion (KLE) and its application in deriving principal functional components from empirical covariance operator estimates. We analyze the approximation errors from truncated KLEs and investigate the learned distributions for smooth activations, highlighting typical functions and anomalies. The Discrete Wavelet Transform (DWT) is employed to explore the spaces of networks induced by the non-smooth activation functions. We discuss coarse coefficients, the energy fraction of details, and the main wavelet coefficients’ projection to a lower-dimensional manifold. Additionally, we assess the learned distributions within this context.
Introduction
Introduction
Project Description
Project Description
We explore the distributions of random shallow multi-layer perceptrons (MLPs) with a fixed architecture. The collection of neural nets with random weights and bias sampled from independent standard normal distributions for a given activation function σ is a random variable on the space of continuous functions. More precisely, the fixed architecture has width 5 and depth 2, with real input and output. The purpose of this work is to get insights on the distribution for several activation functions and to compare them.For a given activation function σ, the family of functions is of the form where ,, are vectors of dimension 5 and is a 5x5 matrix. Hence, each realisation inherits the continuity and the differentiability properties of σ and that collection is a linear subspace of continuous functions.We study the following activation functions: Tanh, Swish, ReLU, Sigmoid, Sin and SELU.Without loss of generality, we will restrict the study to functions on [0,1]. The interval is discretized by steps of size for a given refinement r (typically r=8).

β
i
w
i
W
2
-r
2
Theoretical justification of the project
Theoretical justification of the project
A foundational result in neural network theory is the universal approximation theorem [1]. In particular, Guliyev and Ismailov constructed a smooth sigmoidal activation function providing universal approximation property for two hidden layer feedforward neural networks with a finite number of neurons in hidden layers (5 for real valued functions) [2].
◼
This result justifies the choice of our architecture that is capable of being dense in the space of continuous function.
◼
To assess the potential of classic activation functions, we can conduct a descriptive and comparative analysis of their spaces of functions.
Agenda
Agenda
We will follow the following steps:
◼
Distributions of basic statistics
◼
Mean, Standard Deviation, Norm and Range
◼
Empirical Estimates of the First Four Moments Functions
◼
Mean, Variance, Skewness and Kurtosis
◼
Karhunen-Loève Expansion
◼
Principal Functional Components from Empirical Covariance Operator Estimate
◼
Similarity Measures of Generated Networks
◼
Analysis of Approximation Truncated Expansion Errors
◼
Learned Distribution for Smooth Activations based on Karhunen-Loève Expansion
◼
Gaussian Mixtures Estimates
◼
Typical Functions & Anomalies
◼
Discrete Wavelet Transform to Explore the Spaces of Networks Generated by ReLU & SELU
◼
Coarse Coefficients
◼
Energy Fraction of Details
◼
Feature Space Plot of the Main Wavelet Coefficients
◼
Gaussian Mixture Estimates
Setup
Setup
In[]:=
width=5;depth=2;baseSeed=123;r=8;xs=Range[0.,1,2^(-r)];(*WeightsDimension=5+25+5,BiasesDimension=5+5*)nExp=45*100;activations={Tanh,"Swish","ReLU","Sigmoid",Sin,"SELU"};
◼
Generate Simulations per Activation Function
◼
Graphic Options
Activation Functions of Interest
Activation Functions of Interest
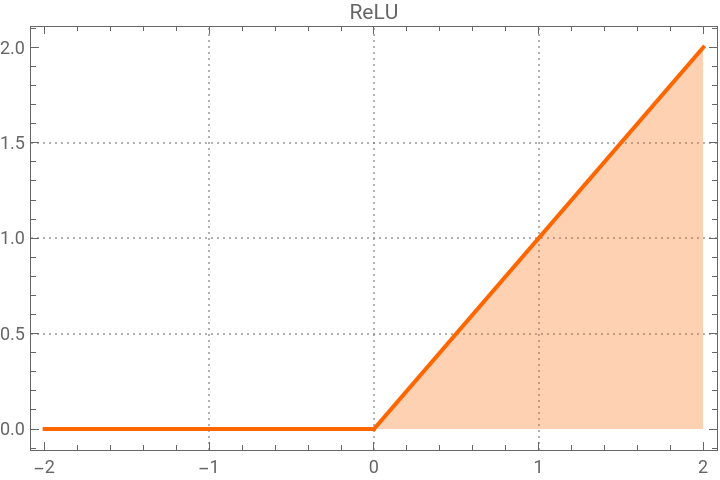
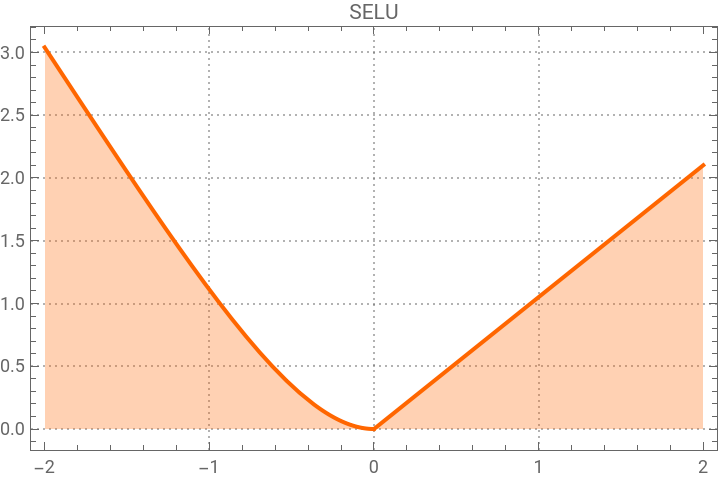
We consider the following continuous non-linearities:
Out[]=
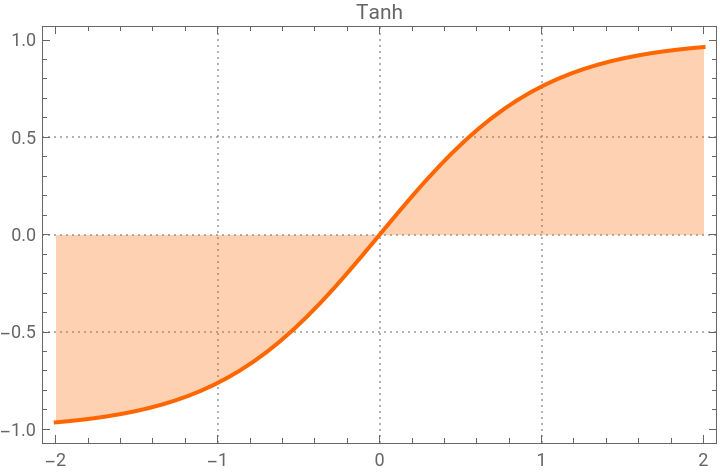
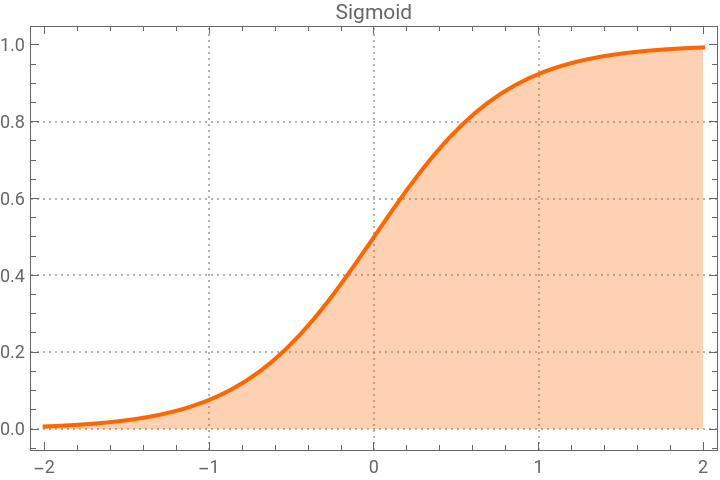
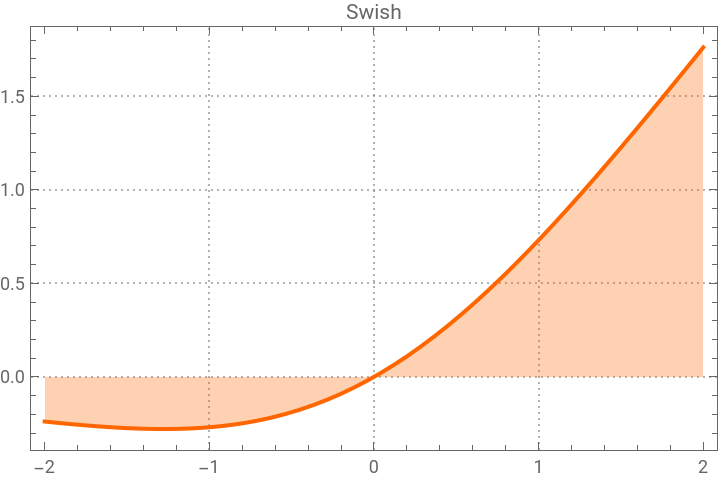
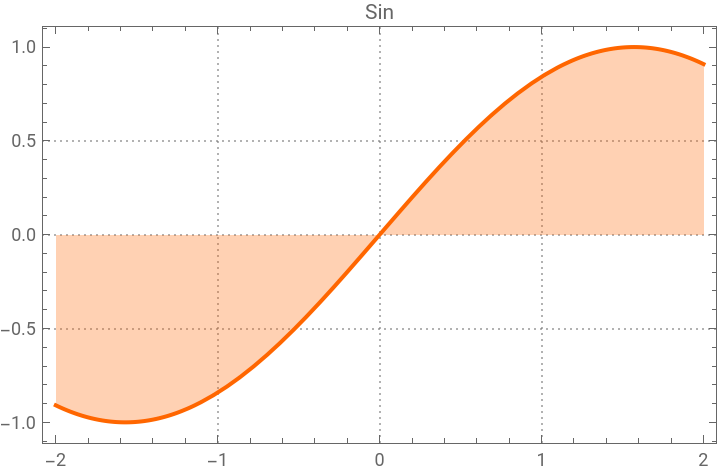
Differentiability
Differentiability
◼
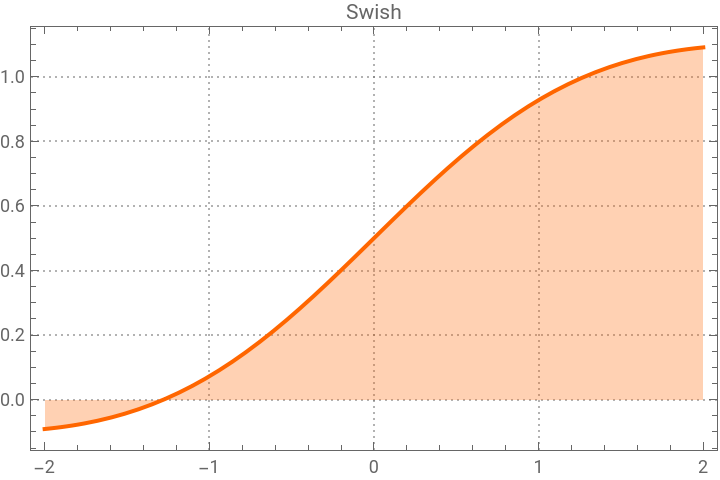
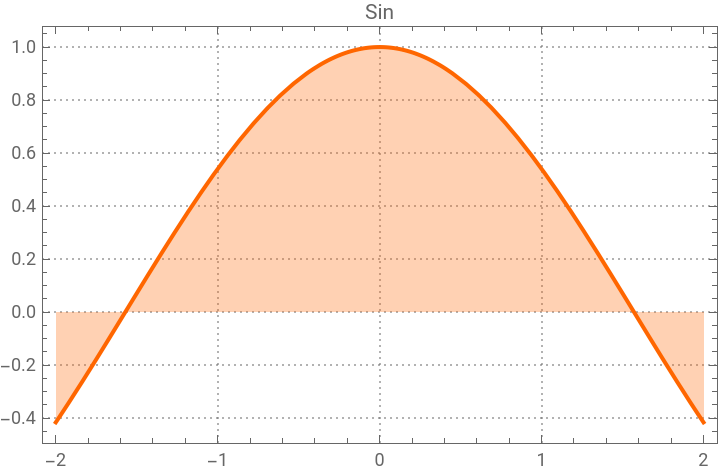
Tanh, Swish, Sigmoid and Sin are infinitely differentiable
◼
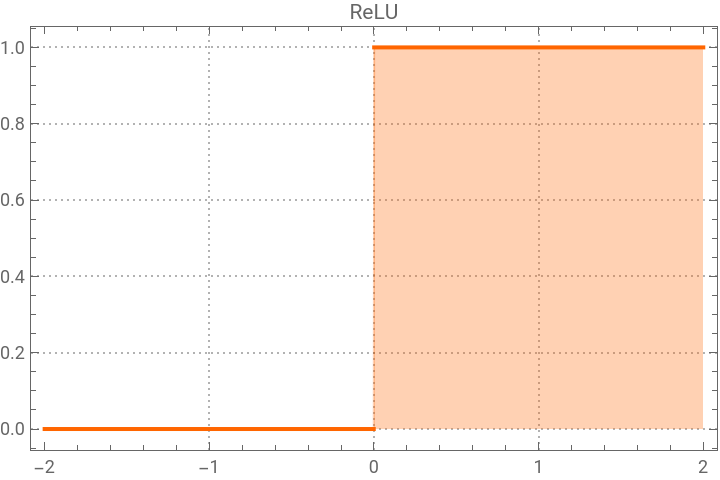
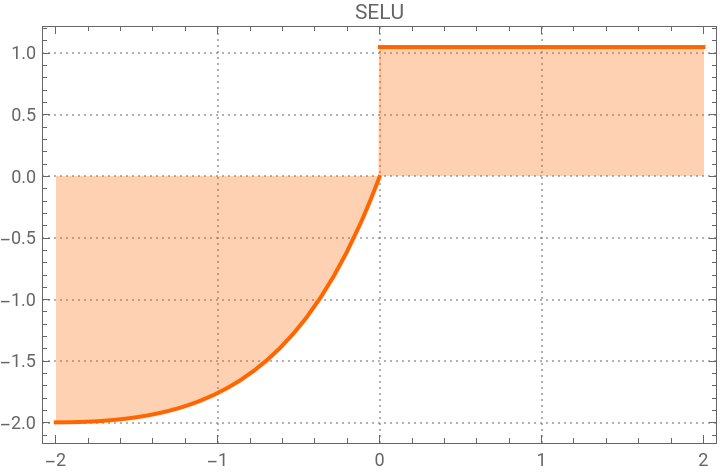
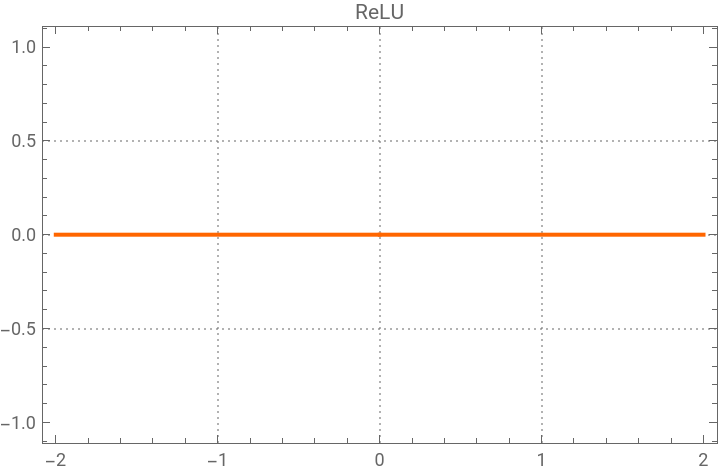
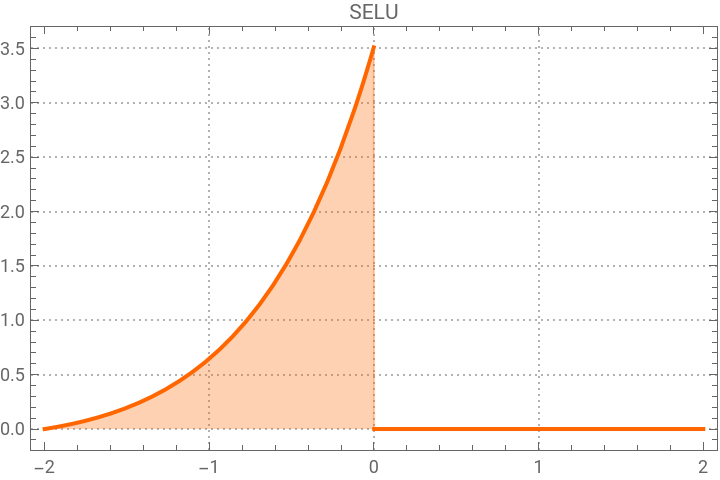
Note that ReLU & SELU are not differentiable at 0, but infinitely differentiable elsewhere
◼
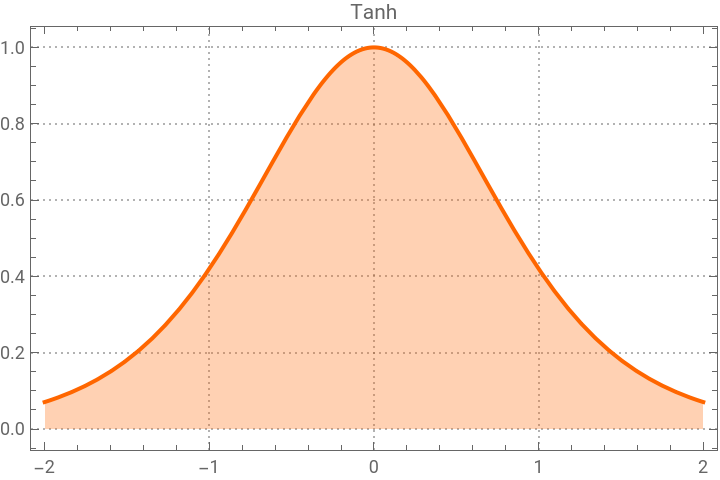
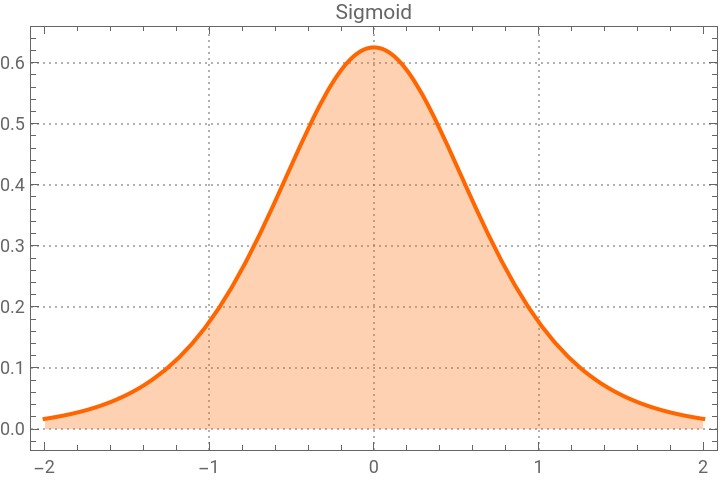
First derivatives of the activations:
Out[]=
◼
Second derivatives of the activations:
Out[]=
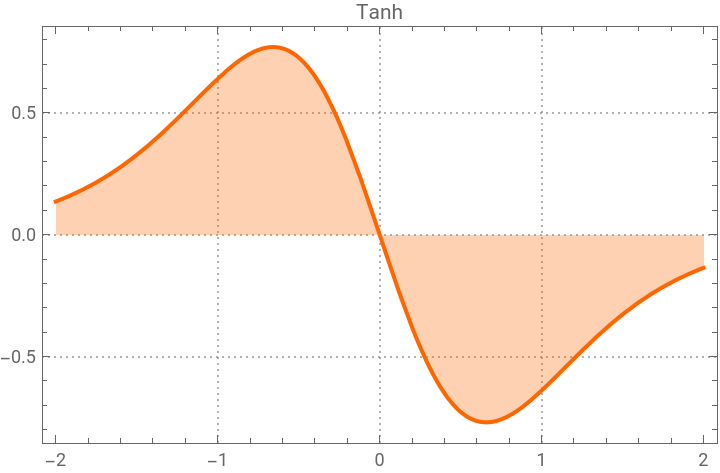
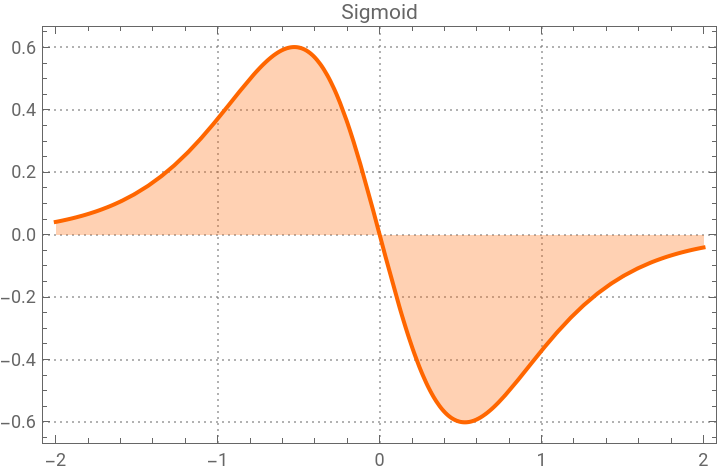
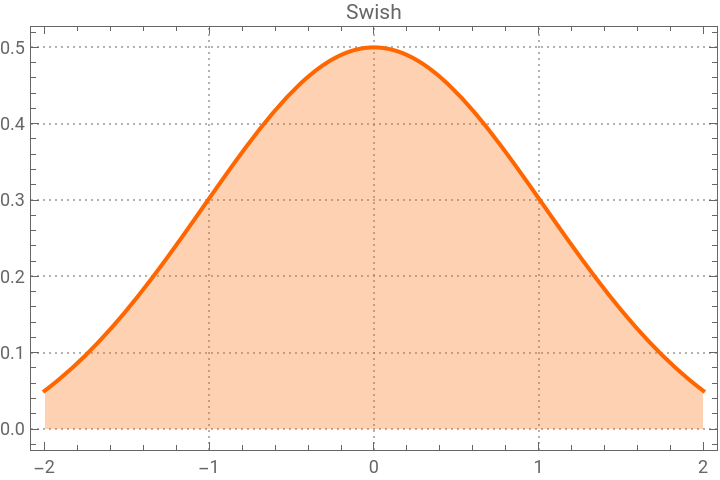
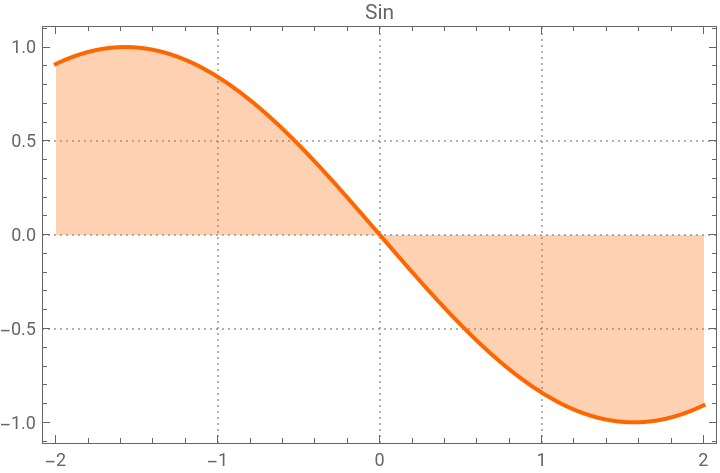
Fourier-Legendre
Fourier-Legendre
See [3] for Legendre polynomials and [4] for Fourier-Legendre basis expansion.
◼
The smooth activations (Tanh, Swish, Sigmoid and Sin) are well approximated on [-1,1] by their Fourier-Legendre series of order 5
◼
But when we increase the domain to [-2,2], it requires expansions of order 9 to get good approximations for Tanh and Sigmoid. At order 9, we get also decent approximations for the singular ReLU and SELU
Discrete Wavelet Transform
Discrete Wavelet Transform
See [5], [6] and [7] to review the discrete wavelet transform.
The wavelet scalograms below highlight the transform coefficients as rows of colorized rectangles, in which large absolute values are shown darker and each subsequent row corresponds to different wavelet index specifications:
The wavelet scalograms below highlight the transform coefficients as rows of colorized rectangles, in which large absolute values are shown darker and each subsequent row corresponds to different wavelet index specifications:
MLPs on [0,1] with Varying Activation Functions
MLPs on [0,1] with Varying Activation Functions
Exploratory Data Analysis
Exploratory Data Analysis
Preliminaries
Preliminaries
Distributions of Basic Statistics
Distributions of Basic Statistics
We consider the following statistics: mean, standard deviation, norm and range (see below). We observe that the mean distributions are all unimodal and symmetric.
◼
Swish, ReLU and SELU are clearly more peaked than a normal distribution.
◼
Tanh is close to normal
◼
ReLU, Sigmoid and Sin have thin tails (Laplace distribution, Logistic distribution and Logistic distribution respectively)
Moreover, the scales distributions are right skewed, and can be well approximated by a mixture of two Gamma distributions or a mixture of one Gamma distribution and one Log Normal distribution.
◼
Mean
◼
StandardDeviation
◼
Norm
◼
Range
Empirical Estimates of the First Four Moments Functions
Empirical Estimates of the First Four Moments Functions
◼
There is near-zero mean and skewness across all marginal distributions, except for SELU which has a small skewness.
◼
The variance and kurtosis clearly separates the activations Tanh, Sigmoid and Sin, for which they are rather constant with small values, from Swish, ReLU and SELU for which they are increasing with large values.
Karhunen-Loève Expansion
Karhunen-Loève Expansion
See [8] for a review of the Karhunen-Loève Expansion.
It’s an informed decision to perform Karhunen-Loève Expansion with a fixed number, in this case six, of principal functional components. Here’s why:
We first selected the number of principal functional components based on the usual criteria of cumulated sums of eigenvalues on one hand and eigenvalues normalised by the first eigenvalue on the other. Then, we had to deal with a lot of simulations not having a decent approximation through expansion for which we looked at the principal functional components of their residuals. The results of the whole process was not far from retaining directly 6 principal functional components.
The principal functional components are smooth and well approximated by their Legendre basis expansion up to degree 9.
Principal Functional Components from Empirical Covariance Operator Estimate
Principal Functional Components from Empirical Covariance Operator Estimate
Below are the first 6 eigenvalues of the empirical covariance operator:
And below are the corresponding principal functional components:
Similarity Measures of Generated Networks
◼
Principal Angles for the Spaces Generated by Principal Functional Components
See [7] and [8] for the the distance used.
◼
Legendre Basis Expansion of Principal Functional Components (up to degree 9)
See [3] for Legendre polynomials and [4] for the Legendre basis expansion.
As we can see below the errors are small:
Below is a 2-nearest neighbors graph:
The proximity between spaces induced by the principal functional components coefficients is in accordance with the one from the distance matrix previously calculated. Moreover, we observe that
◼
The space of networks generated by ReLU and SELU are close (closest pair), while the farthest pair is (ReLU, Sigmoid)
◼
The ones generated by Tanh and Sigmoid are also close but to a less extent
Analysis of Approximation Truncated Expansion Errors
Analysis of Approximation Truncated Expansion Errors
◼
As expected there are large errors for ReLU & SELU given that they are not differentiable at zero. More precisely at 1% threshold, there are a proportion of errors of 30% for ReLU and 15% for SELU. We would need a very large expansion to approximate well the networks generated. In this case, the Discrete Wavelet Transform is clearly an adapted framework to consider.
◼
For the other activations, the errors are quite small. The Swish and Sigmoid cases are well handled by the Principal Functional Components (almost no errors at 1% threshold). Outliers for Tanh & Sin provide interesting networks. To explore them, the Fourier-Legendre Series Expansion is clearly a more adapted framework to consider.
Below are the proportion of large relative errors (>1%):
◼
Abnormal functions (relative errors >1%)in the case of smooth activations Tanh & Sin
There are 164 and 121 abnormal functions among the Tanh and Sin simulations respectively:
Below are examples of such functions:
Learned Distribution for Smooth Activations based on Karhunen-Loève Expansion
Learned Distribution for Smooth Activations based on Karhunen-Loève Expansion
◼
For the smooth activations (Tanh, Swish, Sigmoid and Sin), we learn approximated distributions as Gaussian Mixtures for the random functions generated using their truncated Karhunen-Loève expansion coefficients.
◼
The goodness of fit (as measured by cross-entropy) is much better for Sigmoid and Swish compared to Sin, with Tanh in between.
◼
Surprisingly, the modes of the Gaussian Mixtures don’t correspond to typical networks (they exhibit very different shapes).
◼
Not typical networks (anomalies) are clearly more complex than typical networks, and provide an interesting set for initialization to train a neural network on a complex task.
Gaussian Mixtures Estimates
Gaussian Mixtures Estimates
Goodness of fit (cross-entropy):
Below are the Gaussian modes for each process:
And here are some random variates from the learned distributions:
Core Dense points: “Typical” networks
Core Dense points: “Typical” networks
Below are typical networks (high density separated points):
The graph of the typical networks above clearly resembles to the ones from the sampled MLPs in the section MLPs on [0,1] with Varying Activation Functions.
Anomalies: “Atypical” networks
Anomalies: “Atypical” networks
Below are the numbers of atypical nets in each simulation, which contains 4500 nets:
And here are some of them:
Atypical networks exhibit significant non-linearity and variability in contrast to the typical ones.
Discrete Wavelet Transform to Explore the Spaces of Networks Generated by ReLU & SELU
Discrete Wavelet Transform to Explore the Spaces of Networks Generated by ReLU & SELU
See [5], [6] and [7] to review the discrete wavelet transform.
The computation of the discrete wavelet transform (Haar wavelet) of the networks at the maximum refinement level shows the following:
◼
The distributions of coarse coefficients are unimodal and symmetric, thin tail for ReLU (Laplace distribution) but fat for SELU (Student-t distribution)
◼
The energy fractions of the details coefficients are similar in terms of distributions. Their distributions are very peaked at the median.
◼
Almost all energy is concentrated at the last two details, the last one being largely dominant (with 19% and 74% respective median fractions)
◼
The projections (to a manifold of dimension 2) of the main wavelet coefficients have very similar shapes for ReLU and SELU
◼
But the learned distributions looks different at the glance. They are indeed close somehow: the symmetric KL Divergence between the two learned Gaussian Mixture is in the same order of magnitude than the symmetric KL Divergence between the learned distribution and a corresponding histogram distribution for ReLU
◼
For SELU, the fit of the learned Gaussian mixture is good and makes sense given the shape of its projection (to a manifold of dimension 2)
Retrieve the Wavelet Transforms
Retrieve the Wavelet Transforms
Coarse coefficients
Coarse coefficients
Distribution of the coarse coefficients:
Skewness of the coarse coefficients:
Most likely distribution of the coarse coefficients:
Energy Fraction of Details
Energy Fraction of Details
Here are the details:
Mean of the energy fractions:
Median of the energy fractions:
Distribution of the energy fractions per detail:
Feature Space Plot of the Main Wavelet Coefficients
Feature Space Plot of the Main Wavelet Coefficients
Learned Distribution - Gaussian Mixtures Estimates
Learned Distribution - Gaussian Mixtures Estimates
Goodness of fit (cross-entropy):
KL Divergence between the learned distribution and a corresponding histogram distribution for ReLU:
KL Divergence between the learned distribution and a corresponding histogram distribution for SELU:
KL Divergence between the learned distribution for ReLU and SELU:
Below are the Gaussian modes for each process:
And here are some random variates from the learned distributions:
Concluding Remarks
Concluding Remarks
This study has delved into the intricate world of shallow multi-layer perceptron networks, specifically focusing on the statistical and mathematical techniques to analyze, represent, and compare distributions generated by classic activation functions. Here are the key takeaways from our observations and analyses:
◼
Distributions of Basic Statistics
◼
All activation functions produced unimodal and symmetric mean distributions.
◼
Swish, ReLU, and SELU showed sharper peaks than normal, while Tanh closely followed a normal distribution.
◼
ReLU, Sigmoid, and Sin had thin tails, whereas Swish and SELU had fat tails.
◼
The scale distributions were well approximated by a mixture of two Gamma distributions or a mixture of one Gamma and one Log-Normal distribution.
◼
Empirical Estimates of the First Four Moments
◼
Mean and skewness were minimal, except for SELU which showed small skewness.
◼
The variance and kurtosis effectively distinguished the activations Tanh, Sigmoid and Sin, for which they are rather constant with small values, from Swish, ReLU and SELU for which they are increasing with large values.
◼
Karhunen-Loève Expansion
◼
The Karhunen-Loève expansion was performed with six principal functional components based on cumulative eigenvalues and normalized eigenvalues. Despite initial simulation challenges, retaining six components provided a good balance between complexity and approximation accuracy.
◼
The principal functional components were smooth and well-approximated by their Legendre basis expansion up to degree nine.
◼
Similarity Measures of Generated Networks
◼
The proximity between spaces induced by the principal functional components’ Legendre coefficients aligned with the distances measured using principal angles.
◼
Networks generated by ReLU and SELU were the closest pair, while ReLU and Sigmoid were the farthest. Tanh and Sigmoid also showed some proximity, albeit to a lesser extent.
◼
Analysis of Approximation Truncated Expansion Errors
◼
Large approximation errors were noted for ReLU and SELU due to their singularities at zero, with 30% and 15% of errors at the 1% threshold, respectively. This indicates the need for a large expansion, making the discrete wavelet transform a suitable alternative.
◼
For smooth activations, errors were minimal. Swish and Sigmoid were well-handled by the principal functional components. Outliers for Tanh and Sin presented interesting networks, better explored using the Fourier-Legendre Series Expansion.
◼
Learned Distributions for Smooth Activations
◼
For smooth activations (Tanh, Swish, Sigmoid, Sin), distributions approximated as Gaussian mixtures from truncated Karhunen-Loève expansion coefficients showed varying goodness of fit. Sigmoid and Swish had better fits than Sin, with Tanh in between.
◼
Modes of the Gaussian mixtures did not correspond to typical networks; anomalies were more complex and potentially useful for initializing neural networks for complex tasks.
◼
Discrete Wavelet Transform for ReLU and SELU
◼
The Discrete Wavelet Transform revealed unimodal and symmetric distributions of coarse coefficients, with ReLU having thin tails and SELU having fat tails.
◼
Energy fractions of detail coefficients were similarly distributed, with most energy concentrated in the last two details. The last detail was largely dominant.
◼
Visualizations showed similar shapes for ReLU and SELU when projected onto a two-dimensional manifold. However, their learned distributions differed slightly, with the symmetric KL divergence of the same magnitude than the one between the learned Gaussian mixtures and corresponding histogram distributions for ReLU.
In conclusion, this study provides a comprehensive analysis of the statistical properties of shallow multi-layer perceptron networks with various activation functions. The insights gained offer valuable guidance for initializing and understanding neural networks, particularly in terms of approximation errors, learned distributions, and the effectiveness of different mathematical frameworks.
Acknowledgments
Acknowledgments
I would like to thank the staff of the Wolfram Summer School for providing this enriching opportunity and fostering such a stimulating environment. I am also thankful to Stephen Wolfram for his support of my project.
References
References
2
.Guliyev, N. J., & Ismailov, V. E. (2018), “Approximation capability of two hidden layer feedforward neural networks with fixed weights”, Neurocomputing, 316, 262-269, https://arxiv.org/abs/2101.09181
5
.Mallat, S. (1999), “A Wavelet Tour of Signal Processing. Academic Press”
8
.Wang, J., et al. (2015), “Review of Functional Data Analysis”, https://arxiv.org/abs/1507.05135
10
.Ye, K., & Lim, L. H. (2016), “Schubert varieties and distances between subspaces of different dimensions”. SIAM Journal on Matrix Analysis and Applications, https://arxiv.org/abs/1407.0900
Cite This Notebook
Cite This Notebook