Rui Alves (rui.alves@udl.cat)
Abel Lucido (abel.lucido@udl.cat)
Oriol Basallo (oriol.basallo@udl.cat)
Ester Vilaprinyo (ester.vilaprinyo@udl.cat)
Jordi Bartolome (jordi.bartolome@udl.cat)
Francesc Solsona (francesc.solsona@udl.cat)
Alberto Marin- Sanguino (alberto.marin@udl.cat)
Albert Sorribas (albert.sorribas@udl.cat)
Departament de Ciències Mèdiques Bàsiques, Universitat de Lleida, Lleida, Spain
One of the current trends in middle and higher education is that of gamifying learning. Mathematica has all the basic functionality to facilitate implementing many concrete applications of this trend. This article presents one such application, EpiPlay. EpiPlay is a user-friendly App that introduces many of the basic concepts in Epidemiology, putting them in the context of a game where the player has to apply them to understand the dynamic of random epidemic events arising in populations. This application uses three classical epidemiology models, enabling educators to explain the various parameters that characterize epidemics at three levels of granularity and players to understand how those parameters interact in a user-friendly way.
Introduction
Introduction
Gamification and Mathematica
Gamification and Mathematica
Gamification is the use of gaming principles and elements in non-gaming contexts. Gamification methods are being increasingly applied in on- and offline education [1], with the COVID19 lock downs providing an important push to its use. While restrictions to in person education have mostly been lifted around the western world, it remains to be seen when new lock downs will be put in place. In addition, gamification methods can be and are used for in person communication and education [2].
Mathematica as a platform for gamifying health education
Mathematica as a platform for gamifying health education
The COVID pandemic emphasized the importance of epidemiology as a tool to define appropriate public health policies. Over the last two years, parameters such as the basic reproductive number, , or the infectiousness of a pathogen became important concepts to help explain many of the public health decisions made by governments. High , combined with mortality rates comparable to those of the 1918 Spanish flu and saturated public health systems were use to decide over which periods and how whole countries confined their populations. A fairly complete timeline of the COVID events and reaction to them can be found at https://www.who.int/emergencies/diseases/novel-coronavirus-2019/interactive-timeline.
While COVID data dashboards became a main stay on the web of research institutes and groups, they also made their way into many newspapers and other webpages dedicated to informing the general public. While these dashboards were helpful for everyone to keep up to date and follow the evolution of the COVID19 pandemic, they were less helpful in explaining to the public how mathematical models were used to make pandemic-related policy decisions and approximately predict their consequences.
Mathematical models are an invaluable tool of the trade for epidemiologists. These models can be used to fit epidemic data and calculate important information about a pathogen, such as its infectiousness, incubation time, mortality rates of the pathogen-caused disease, among others. Perhaps more importantly, they can be used to test the effects of alternative scenarios on the progression of an epidemic. For example, models can be used to estimate how confining people affects the interactions between sick and healthy persons, changing the number of new infections caused by each sick person.
R
0
R
0
While COVID data dashboards became a main stay on the web of research institutes and groups, they also made their way into many newspapers and other webpages dedicated to informing the general public. While these dashboards were helpful for everyone to keep up to date and follow the evolution of the COVID19 pandemic, they were less helpful in explaining to the public how mathematical models were used to make pandemic-related policy decisions and approximately predict their consequences.
Mathematical models are an invaluable tool of the trade for epidemiologists. These models can be used to fit epidemic data and calculate important information about a pathogen, such as its infectiousness, incubation time, mortality rates of the pathogen-caused disease, among others. Perhaps more importantly, they can be used to test the effects of alternative scenarios on the progression of an epidemic. For example, models can be used to estimate how confining people affects the interactions between sick and healthy persons, changing the number of new infections caused by each sick person.
Educating the general public at every educational level about the usefulness of models in the context of decision making during epidemics is a complex task. One of the rising trends in education on complex issues is that of gamifying how knowledge is acquired [3]. Given its versatility, the field is ripe for developing gamifying applications using the Mathematica platform. Properly used, Mathematica and the Wolfram language provide a powerful platform to develop Apps that facilitate the use of gamification in education.
Here, we present EpiPlay, a game developed in Mathematica with the aim of contributing towards gamification of epidemiological education. We provide EpiPlay as a Mathematica package that Mathematica users can install
Here, we present EpiPlay, a game developed in Mathematica with the aim of contributing towards gamification of epidemiological education. We provide EpiPlay as a Mathematica package that Mathematica users can install
EpiPlay
EpiPlay
EpiPlay is a six pane game. Panes one to three are static and provide basic information about epidemiological concepts, game play, and mathematical models in Epidemiology. Panes four to six provide users with the game, at different complexity levels.
To use EpiPlay download the Mathematica package provided as supplementary material. Then, go to your “~\AddOns\Applications\” directory and create the directory “~\AddOns\Applications\EPIPLAY\”. Finish by placing the EPIPLAY.wl file in that directory. Once this is done open a notebook and run the following code:
To use EpiPlay download the Mathematica package provided as supplementary material. Then, go to your “~\AddOns\Applications\” directory and create the directory “~\AddOns\Applications\EPIPLAY\”. Finish by placing the EPIPLAY.wl file in that directory. Once this is done open a notebook and run the following code:
Needs["EPIPLAY`"];EpiPlay[]
EpiPlay will start as an independent window with six panes. We now describe those pane and how the EpiPlay game is assembled and works.
Pane 1: Introduction
Pane 1: Introduction
This pane introduces the audience of the game to a few key concepts in epidemiology using a static infographic (Figure 1). The infographics present the various aspects of a parasite that may determine epidemic progression in a population. Concepts like infectiousness, death rate, or incubation period are presented here.
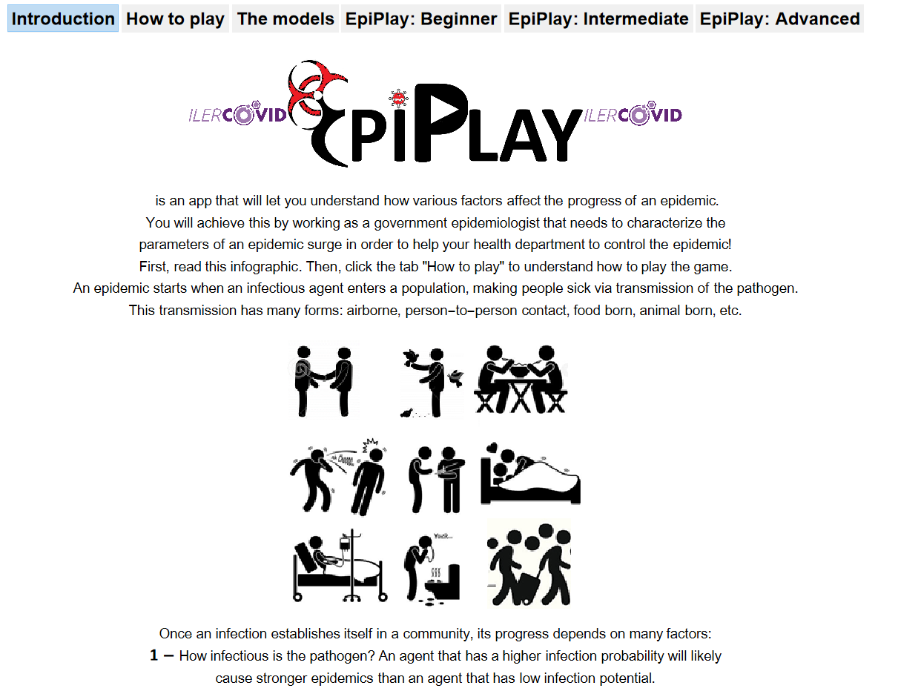
Figure
0
. Infographic explaining key concepts in epidemiology to a general audience.Pane 2: How to play
Pane 2: How to play
The second pane explains to the user how EpiPlay works (Figure 2). In brief, there are three playing levels: Beginner, Intermediate, and Advanced. To start playing, users must choose one of these panes. Once they do so, a random set of reasonable parameter values is generated for the level of choice. These parameters correspond to those of the SIRD (Beginners), SEIRD (Intermediate), or SIDARTHE (Advanced) epidemiological models (see Section “Models” for details). The parameter set is used to simulate the epidemic progression up to a randomly determined final time. Up to 10% of noise is added to each data point. The noisy data set is provided to the user and s/he is asked to start a timer in order to enable game play.
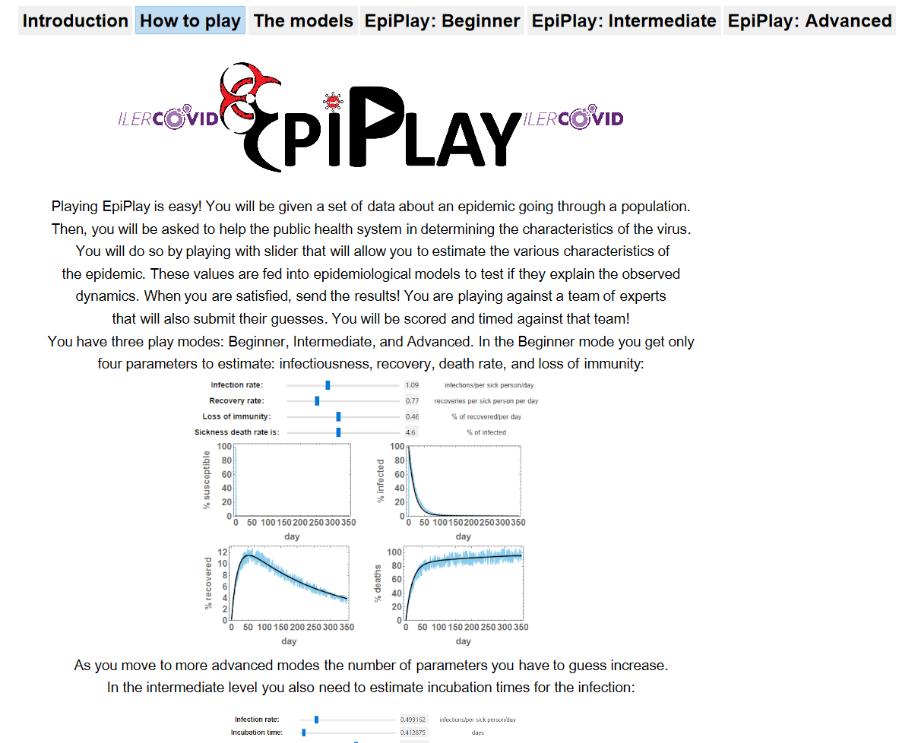
Figure
0
. Infographic explaining how to play EpiPlay.Once the timer starts, a set of dynamic sliders appears, initialized at random values. Each slider control one of the model parameters. The time curves generated by a model with those parameter values appears superimposed to the noise data plots. The user then needs to play with the sliders in order to fit the curves to the noise data points. When s/he is happy with the fit, the “Send results!” button should be pressed.
The “fitted” parameters are compared to the original random parameter set. The fitting error with respect to the noisy data is also calculated using a least square sum for both, the original parameter set and the fitted parameter set. The percent difference is calculated. If the difference between a “fitted”parameter and the original parameter is less than 10%, the player gets a gold medal. If the error is between 10% and 20%, a silver medal is given. If the error is between 20% and 30% the user gets a bronze medal. Bigger errors are given “Finisher” medals.
The time that the user takes to submit a prediction is also considered to be important for the game, and, together with the fitting error to the noisy data set, it is used to calculate the high score for the player (See subsections Pane 4, Pane 5, and Pane 6 for details).
Once the user submits its guess results are displayed as exemplified in Figure 3:
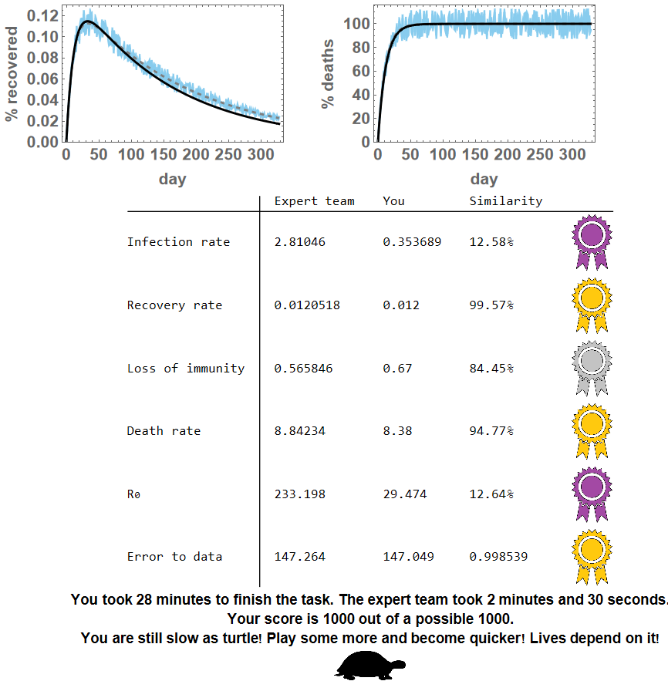
Figure
0
. Scoring the play. The user can then press the “Start over!” button to play again with a new random set of parameters. A record of the top-three scores is maintained and displayed to the player in order to motivate improved game play (Figure 4).
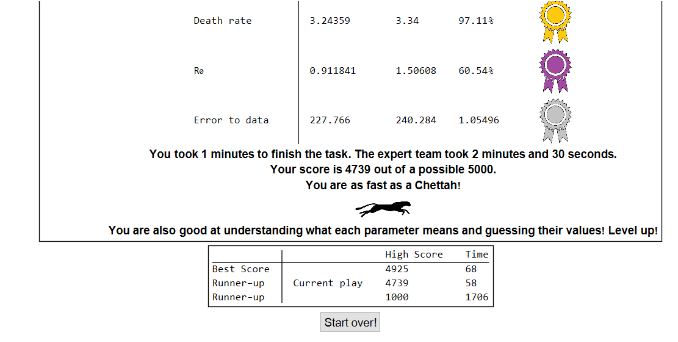
Figure
0
. Keeping high scores. Pane 3: The models and their use for data generation and parameter guessing
Pane 3: The models and their use for data generation and parameter guessing
The models: SIRD, SEIRD and SIDARTHE
The models: SIRD, SEIRD and SIDARTHE
The third pane gives users an intuitive understanding of the epidemiological models underlying the three levels of the game, by presenting the SIRD, SEIRD, and SIDARTHE models in a simple infographic. No equations are shown to the user, making this pane appropriate to enable quantitative education in epidemiology for non-mathematicians.
SIRD, SEIRD and SIDARTHE are compartmental models used in epidemiology to describe how epidemics spread through populations. The SIRD model is the simplest one, and thus it is used for the Beginner’s play level. In this model, S represents the individuals that are susceptible to infection, I represents the Infected individuals, and R represents the individuals that have recovered from the infection. D stands for the deaths. In the SIRD model, individuals that are (S)usceptible to infection come into contacts with (I)nfected individuals and become sick during the INFECTION process. Most Infected people become (R)ecovered individuals. Unfortunately, a small fraction of the infected may also find (D)eath. The SIRD model can also consider loss of immunity over time, leading (R)ecovered individuals to become (S)usceptible again. (Figure 5).
SIRD, SEIRD and SIDARTHE are compartmental models used in epidemiology to describe how epidemics spread through populations. The SIRD model is the simplest one, and thus it is used for the Beginner’s play level. In this model, S represents the individuals that are susceptible to infection, I represents the Infected individuals, and R represents the individuals that have recovered from the infection. D stands for the deaths. In the SIRD model, individuals that are (S)usceptible to infection come into contacts with (I)nfected individuals and become sick during the INFECTION process. Most Infected people become (R)ecovered individuals. Unfortunately, a small fraction of the infected may also find (D)eath. The SIRD model can also consider loss of immunity over time, leading (R)ecovered individuals to become (S)usceptible again. (Figure 5).
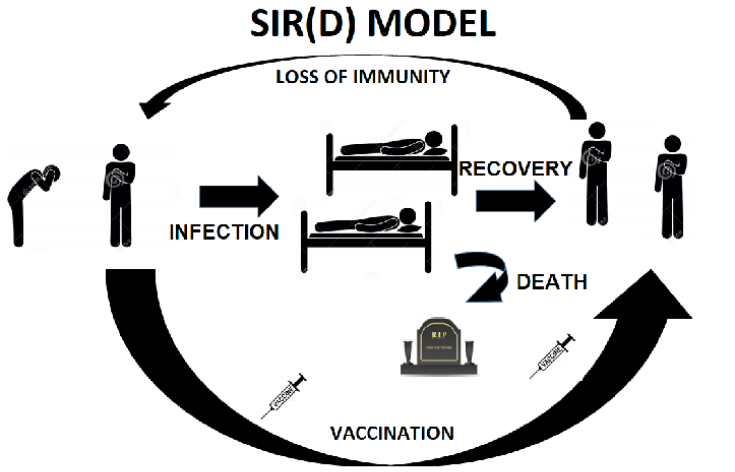
The SIRD model is implemented using the following function:
The SEIRD model is used in the Intermediate playing mode, as it is slightly more complex than the SIRD model: SEIRD addsanother population compartment to the SIRD model: that of exposed people incubating the disease. This population group is represented by E. The interactions between compartments in the SEIRD model are the same as those in the SIRD model, with the modification that (S)usceptible individuals become (E)xposed individuals, which can then become (I)nfected (Figure 6).
The SEIRD model is implemented using the following function:
The SIDARTHE model is used in the Advanced playing mode. It is significantly more complex than both, the SIRD and the SEIRD models. A SIDARTHE model considers that an individual may be in many alternative states during an epidemic event. SIDARTHE differentiates between detected and non detected cases. In brief, (S)usceptible individuals come into contacts with and can be contaminated by 6 different types of sick individuals. (I)nfected individuals are assymptomatic, undetected, and equivalent to (E)xposed individuals in the SEIRD model). (I)nfected individuals can become (D)iagnosed (asymptomatic patients). Patients can then become (A)iling. (I)nfected individuals can also directly become (A)iling patients, defined as being symptomatic but undetected. All infected patients can become (R)ecognized patients. By definition, this group is symptomatic and detected. All patients can also become (T)hreatened if they show acute symptomatology. According to this model, all patients can at some point become (H)ealed or (D)ie. The SIDARTHE model can also account for loss of immunity. (Figure 7).
The SIDARTHE model is implemented using the following function:
The models: data generation and parameter guessing
The models: data generation and parameter guessing
All model functions are slightly modified to generate the noisy data that are given to the player for parameter guessing. For example, the SIRD function is now:
Similar functions are defined for data generation from the SEIRD and SIDARTHE models. When a player first accesses a playing level or presses the “Start over!” button, a random set of parameter values is generated and passed on to the SIRDGen, SEIRDGen, or SIDARTHEGen functions, returning the noisy data set. This dataset is used to generate the plots that are the guide for parameter guessing.
When the player presses the “Start timer” button, the SIRD, SEIRD, or SIDARTHE functions are feed with a new random set of parameter values and the noiseless dynamical curve of the model is superimposed to the noisy data. Players then use the sliders to make this curve as similar to the noisy data as they see fit. They conclude a round of playing by submitting their guesses.
When the player presses the “Start timer” button, the SIRD, SEIRD, or SIDARTHE functions are feed with a new random set of parameter values and the noiseless dynamical curve of the model is superimposed to the noisy data. Players then use the sliders to make this curve as similar to the noisy data as they see fit. They conclude a round of playing by submitting their guesses.
Pane 4: The Beginner’s play level
Pane 4: The Beginner’s play level
The Beginners play level starts by showing four graphs of the spread of an epidemic, collected by a governmental organization. They represent the percentage of the population that is in each of the four states of the SIRD model at each day. The player is asked to assist in determining the parameters of the epidemic and help understand how the virus propagates in the population. Parameters are randomized each time the play starts. The upper limit of the randomization interval is established by the highest value for that parameter in all real-world epidemics reported in the literature [4-6]. The lower limit is set to 0. Once the data is generated, a 10% white noise is added to each data point. This noisy data set is then represented in the plots shown to the player. The end time for the data is also randomly chosen. The player can randomly be assigned data from epidemics that are just beginning, have already ended, or are anywhere between these two extremes (Figure 8).
The players are scored both for accuracy of the prediction and for time of play. Players that finish in less than 2 min : 30s can score up to 5000 point. If the time is between 2 min : 30s and 5 min, they can score up to 3000 points. If the time is higher than 5 min the maximum available score is 1000 points. The real score is calculated by multiplying the maximum available score by the percent accuracy in reproducing the time curves for the noisy data. By using the slider, the player can change parameter values until the black curve (calculated by numerical integration of the SIRD model with the parameter values chosen by the player) overlaps the blue dataset. Once the player is happy and submits the prediction, the score is calculated and shown.
Pane 5: The Intermediate play level
Pane 5: The Intermediate play level
The Intermediate play level starts by showing the same graphs of the spread of an epidemic shown in the Beginners level, with data collected by a governmental organization. The player is asked to assist in determining the parameters of the epidemic and help understand how the virus propagates in the population. Parameters are randomized each time the play starts in the same way as described in the Pane 4 subsection. In this level, ind addition to all the parameters included in the Beginner’s level, the player must also estimate incubation time for the disease. The data here is generated using the SEIRD model, and noise is added as described in the previous subsection.
The players are also scored both for accuracy of the prediction and for time of play. Players that finish in less than 3 min can score up to 7000 points. If the time is between 3 min and 6 min, they can score up to 3500 points. If the time is higher than 6 min the maximum available score is 1500 points. The real score is calculated by multiplying the maximum available score by the percent accuracy in reproducing the time curves for the noisy data. By using the slider, the player can change parameter values until the black curve (calculated by numerical integration of the SEIRD model with the parameter values chosen by the player) overlaps the blue dataset. Once the player is happy and submits the prediction, the score is calculated and shown (Figure 9).
Figure 9. The fully deployed Intermediate’s level of the game, after submitting the player’s parameter guesses.
Pane 6: The Advanced play level
Pane 6: The Advanced play level
The Advanced play level starts by showing a similar set of graphs of the spread of an epidemic as the lower levels, with data collected by a governmental organization (Figure 10). The population is now divided into seven subgroup. Parameters are randomized each time the play starts in the same way as for the other two playing levels. The SIDARTHE model is now used for data generation and parameter fitting.
Figure 10. Starting playing at the Advanced play level.
All playing is as in the less complex levels. Still, the number of parameters that need to be guessed is now double that of the intermediate level, as shown in Figure 11. Players that finish in less than 5 min can score up to 10000 points. If the time is between 5 min and 7 min, they can score up to 5000 points. If the time is higher than 7 min, the maximum available score is 2000 points. The real score is calculated by multiplying the maximum available score by the percent accuracy in reproducing the time curves for the noisy data.
Figure 11. The fully deployed Intermediate’s level of the game, after submitting the player’s parameter guesses.
The possibility of parameter interactions is now much higher and the difficulty of guessing the correct parameters is also higher. An example of this is shown in Figure 12, where curve fitting is apparently very good, but many parameters are not well estimated at all.
Figure 12. Curve fitting and parameter guessing. Parameter compensation can lead to good curve fitting with poor parameter guesses.
Discussion
Discussion
EpiPlay presents a concrete example on how Mathematica can be used to gamify education in epidemiology through the use of three simple models (SIRD, SEIRD, and SIDARTHE). Still, it can be easily extended to include other models, either by using the Play Level panes as templates and adding new panes with different models or by replacing the models in each pane with new ones and keeping the pane structure. Further, EpiPlay can be used as an inspiration to develop other gamifying applications for educating people in the basic concepts of different fields of knowledge:
First the educator decides which concepts s/he wants to explain and develops infographics to intuitively explain them. Then, quantitative models that describe the phenomena to which the concepts apply are chosen and used to help the users develop intuition about how the various parameters at play interact and change the dynamics of the process.
First the educator decides which concepts s/he wants to explain and develops infographics to intuitively explain them. Then, quantitative models that describe the phenomena to which the concepts apply are chosen and used to help the users develop intuition about how the various parameters at play interact and change the dynamics of the process.
Summary and Conclusion
Summary and Conclusion
In this paper we present EpiPlay, a user-friendly app to facilitate educating general audiences about several basic concepts in epidemiology. EpiPlay use the DynamicModule function of Mathematica to combine static infographics that explain key concepts in epidemiology with dynamic game play that allows players to develop an intuitive understanding of how quantitative changes in disease parameters affect epidemic dynamics.
In addition, EpiPlay can also be used to illustrates how various parameter sets can generate similar epidemic dynamics, creating awareness about the complexities of parameter determination from epidemics data.
In addition, EpiPlay can also be used to illustrates how various parameter sets can generate similar epidemic dynamics, creating awareness about the complexities of parameter determination from epidemics data.
Acknowledgments
Acknowledgments
This App was developed in the context of project IlerCOVID (2020PANDE00124) from Generalitat de Catalunya and Project FIS PI20/00377, from Instituto de Salud Carlos III.
References
References
J Lopez-Belmonte,ME Parra-Gonzalez, A Segura-Robles, S Pozo-Sanchez “Scientific Mapping of Gamification in Web of Science”, JEur. J. Investig. Health Psychol. Educ, 10(3), 2020 832-847. doi.org/10.3390/ejihpe10030060.
FA Nieto-Escamez and MD Roldán-Tapia, “Gamification as Online Teaching Strategy During COVID-19: A Mini-Review”, Front. Psychol., 12, 2021 648552. 10.3389/fpsyg.2021.648552.
SV Gentry, A Gauthier, B L’Estrade-Ehrstrom, D Wortley, A Lilienthal, L Tudor-Car, S Dauwels-Okutsu, CK Nikolaou, N Zary, J Campbell, J Car, “Serious Gaming and Gamification Education in Health Professions: Systematic Review”, Journal of MEdical Internet Research, 21(3), 2019 e12994. doi.org/10.2196/12994.
NHL Leung “Transmissibility and transmission of respiratory viruses” Nature Rev. Microbiol., 19(2), 2021 528-545. DOI: doi.org/10.1038/s41579-021-00535-6.
MDV Kerkhove, AI Bento, HL Mills, NM Ferguson, and CA Donnelly , “A review of epidemiological parameters from Ebola outbreaks to inform early public health decision-making” Scientific Data, 2, 2015 150019. DOI: 10.1038/sdata.2015.19.
WHO data collections https://www.who.int/data/collections
World Health Organization “WHO COVID Dashboard” (12/30/2021 ) covid19.who.int