Random Wolfram Model Statistics
Random Wolfram Model Statistics
Investigating random generated models from the → signature permutation lists
2
3
3
3
This document requires Random Wolfram Model Harvester -notebook document to be loaded first. The following function with arguments are used from that document: randomPermutationRule[perm236L, perm336L, perm236I, perm336I]
Helper functions
Helper functions
First define some helper functions:
(*Checkifmodeliscenteredaroundthenodeone.Todo:findthemaxcountfornodesandletitbethesearchitem?*)centeredHGQ[evobj_,ones_]:=Length[Select[Last@evobj["AllEventsStatesList"],MemberQ[#,1]&]]<Length[Last@evobj["AllEventsStatesList"]]/ones(*Collectmodelsbyiteratingthemstepbyone.Ifthemodelisfixedpoint,thenthepreviousitemisusedrepeatableattheendofthelist.Sameappliesformodelsthathasmorethan100edgesinthefinalstate.*)collectModels[limit_,rule_]:=Block[{i=0,obj=WM[rule,Automatic,0],a={}},AppendTo[a,obj];While[i<limit,i+=1;(*Preventdoingnewmodelsafterfixedpointorfinalstatemorethan100edgeshasbeenreached.*)Which[And[obj["TerminationReason"]≠"FixedPoint",Length[obj["FinalState"]]<100],obj=WM[rule,obj["FinalState"],1]];AppendTo[a,obj];];Return[a];](*Removewhitespaceinthestring.*)stripWhitespace[str_]:=StringReplace[str," """](*Gigabrainwebsitelinkcreator.*)gigalink[rules_,init_]:=StringJoin["http://gigabrain.io/physics/index.html?rule=",stripWhitespace[ToString[rules]],"&init=",stripWhitespace[ToString[init]],"&steps=10&modelId=undefined&modeType=0"](*HyperlinktotheGigabrainwebsitefor3Dmodelling.*)gigaHyperlink[rules_,init_]:=Hyperlink[rules,gigalink[rules,init]]
Run statistics
Run statistics
100 random items are retrieved from pre-processed left and right hand side permutations. All of them are iterated 20 times with increasing steps to get data for plots.
stats={(*Isevolutionevolvingorfixedonsomepoint?*)If[#["TerminationReason"]"FixedPoint",1,0],(*Istheresulthypergraphconnected?*)If[CHQ[#["FinalState"]],1,0],(*Evolutionobject,step1,2,3,4,...*)#,(**)Total@Function[evobj,If[centeredHGQ[evobj,#],1,0]&/@Table[2^i,{i,1,9}]][#]}&/@collectModels[20,First@#Last@#]&@randomPermutationRule[perm236L,perm336L,perm236I,perm336I]&/@Range[100];
Create four plots from statistics
Create four plots from statistics
What we want to know is:
1. When the model gets fixed, if ever in twenty steps?
2. Is the model connected?
3. What is the growth rate after 5, 10, and 20 steps?
4. Is the model centered? This means that if the most of the nodes are connecting to the node one, then the centered value is lower. For example, if all nodes are connecting to the central node one, then the value is 1. This means that the greater the number is, the smoother the model edges and nodes are distributed and possibly forming 2D, 3D, or other manifold-like structure.
{(*Plot1*)Labeled[ListLinePlot[20-Total[#]&@First@#&/@#&@#],"Non-fixed points in Y steps",LabelStyleDirective[Gray,Small]],(*Plot2*)Labeled[ListLinePlot[Max@second@#&/@#&@#,AxesLabelNone],"Connected models plot -\n1 = connected",LabelStyleDirective[Gray,Small]],(*Plot3*)Labeled[ListLinePlot[2^Max[#]&@Last@#&/@#&@#,PlotRange{1,64},ClippingStyleNone],"Centered model plot - \nGreater number means\nmore distributed nodes (scale 2^n)",LabelStyleDirective[Gray,Small]],(*Plot4*)Labeled[ListLinePlot[Function[x,Around[x,(*Growthrateiscalculatedfor5,10,and20evolutionsandplacedasanuncertaintyintervalnumberobjecttothechart.*){growthRate[Rest[WM[#["Rules"]&@Last@Part[#,3],Automatic,25]["StatesList"]]]-x,x-growthRate[Rest[WM[#["Rules"]&@Last@Part[#,3],Automatic,5]["StatesList"]]]}]][growthRate[Rest[WM[#["Rules"]&@Last@Part[#,3],Automatic,10]["StatesList"]]]]&@#&/@#&@#,FillingBottom],"Growth rate plot - \n5, 10 and 20 evolutions",LabelStyleDirective[Gray,Small]]}&@Transpose[Take[stats,100],{1,3,2}]
Out[]=
,
,
,
Non-fixed points in Y steps |
Connected models plot -1 = connected |
Centered model plot - Greater number meansmore distributed nodes (scale 2^n) |
Growth rate plot - 5, 10 and 20 evolutions |
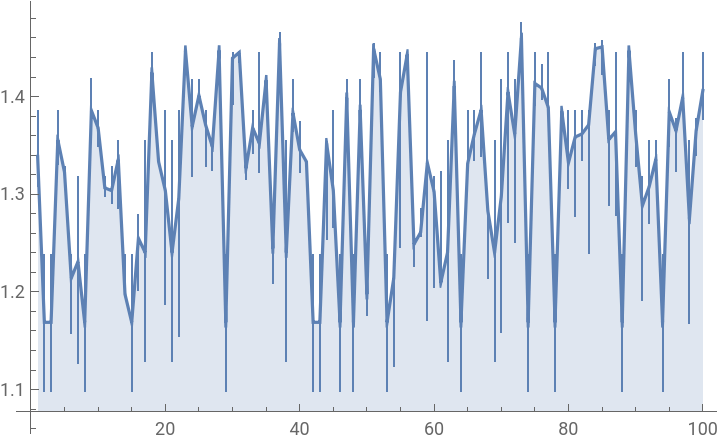
Interpretation of the plots above is the following:
1. Four models are found for the fixed point, three of them got fixed before the fifth step, one got fixed on the step ten
2. All models are still connected after 20 steps, which is promising for the rule generation optimization purposes
3. Two models has less than the 32th part of the nodes connected to the central node, seven models has less than the 16th part of the nodes connected to the central node, five models less than the 8th, and the rest are single pointed graphs
4. Growth rates are between 1.1 and 1.5, growth rate increases more with the models that has smaller rate in the beginning, higher rate models seems to have smaller change in rate in the evolution steps between 5, 10, and 20.
Conjectures:
1. Fixed point filter is good to have in the random rule generator
2. Since all models seems to be connected the connectivity filter might be unnecessary
3. It is possible to filter uninteresting models by central connection criteria. Models having value greater than 4 or 8 are possibly interesting. Single pointed graphs might also be interesting models but they need to be examined by different yet so far unknown criteria
4. It is interesting that the growth rate (GR) is not reaching exponentially (value 2.0), but 1.5 only, in these random models. GR ~1.1 corresponds to the one node increase per step. As for anomaly search, models that has low GR and small difference between 5 to 20 steps might be interesting. Also, models that has higher GR but greater change between 5 to 20 steps would be a deviation from the standard statistics, thus interesting.
Output models in graphical form
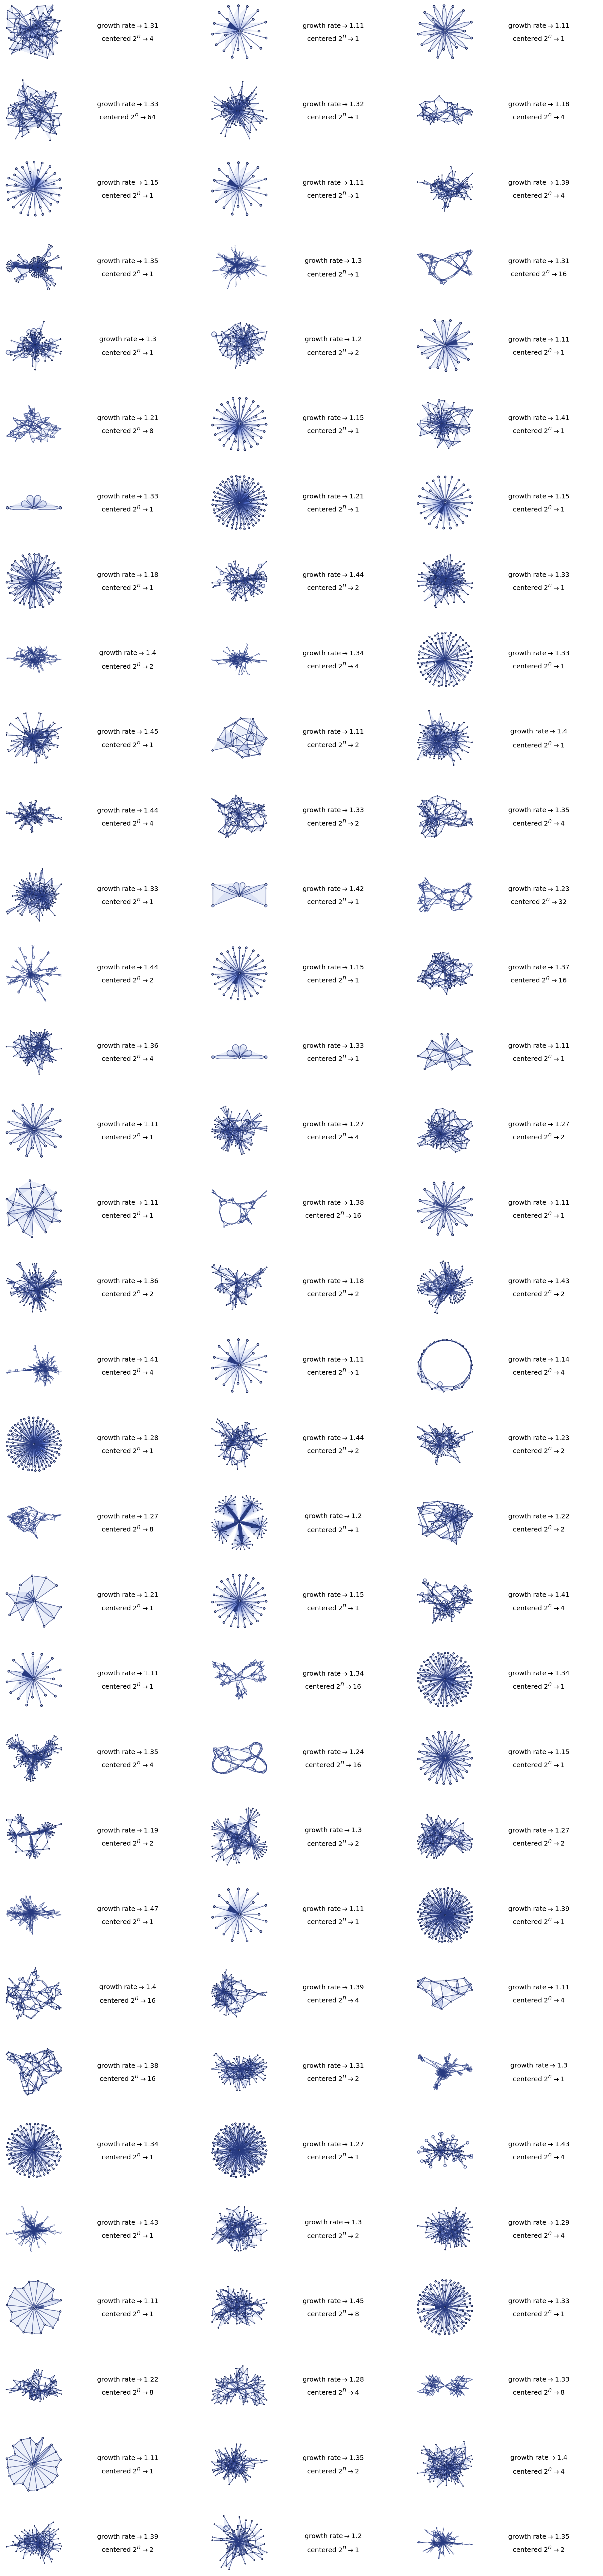
Graph picture links to gigabrain website where the model can be examined in 3D form.
GraphicsGrid[Partition[Function[obj,GraphicsRow[{Hyperlink[#,gigalink[obj["Rules"],First@WM[obj["Rules"],Automatic,0,"StatesList"]],Last[#][[1]]]&@obj["FinalStatePlot"],GraphicsColumn[{"growth rate"NumberForm[#,3]&@growthRate[Rest[WM[obj["Rules"],Automatic,20]["StatesList"]]],"centered "2^Max@Last[#][[4]]}]},ImageSizeFull]][Last[#][[3]]]&/@Take[stats,100],3],ImageSizeFull]
n
2
Out[]=
TODO
TODO
References
References