E-curve and F-curve for the Tanks-in-Series Model of MacMullin and Weber
E-curve and F-curve for the Tanks-in-Series Model of MacMullin and Weber


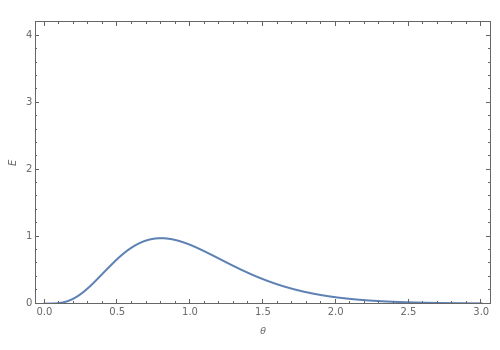
The residence time distribution curve (RTD-curve or E-curve) is the response to a pulse experiment. On the other hand, the response to a step experiment is called the F-curve.
This Demonstration plots both the E-curve and the F-curve for a number of tanks in series.
The E-curve and F-curve are given by the following relationships (MacMullin and Weber, 1935):
E(θ)=
N
N-1
(Nθ)
(N-1)!
-Nθ
e
F(θ)=1-
-Nθ
e
N
∑
i=1
i-1
(Nθ)
(i-1)!
where is dimensionless time and is the number of tanks in series. For a single tank, the E-curve and the F-curve correspond to the mixed tank case, while when is very large, for example equal to 100, the E-curve and the F-curve correspond to the plug flow reactor case.
θ
N
N
Details
Details
R. B. MacMullin and M. Weber, "The Theory of Short-Circuiting in Continuous-Flow Mixing Vessels in Series and Kinetics of Chemical Reactions in Such Systems," Trans. AIChE, 31(2), 1935 pp. 409–458.
Permanent Citation
Permanent Citation