This project examines the distribution and reimbursement patterns of vinblastine—a critical chemotherapy drug used primarily in the ABVD regimen for Hodgkin’s lymphoma—across U.S. state Medicaid programs from 1991 to 2022. Despite vinblastine’s importance in treatment protocols, its availability has faced multiple shortages, reflecting a larger crisis in drug supply chains. Through visual analysis techniques, including heatmaps and time series, this study highlights a concerning trend of unallocated or uncategorized Medicaid reimbursement data over three decades. The findings suggest significant gaps in data categorization, pointing to potential inefficiencies in Medicaid’s data management and reporting systems. This research underscores the urgent need for improved data handling to ensure better health outcomes and highlights broader implications for patient safety and health economics.
Introduction
Introduction
Vinblastine is an indispensable first-line chemotherapeutic agent, particularly effective in treating pediatric Hodgkin’s lymphoma as part of the ABVD regimen. Access to vinblastine significantly improves patient survival rates, with studies showing over 80% survival when administered early (Armas et al., 2022; Johnson et al., 2023). However, the drug has been subject to frequent shortages in the United States, with notable gaps in availability in recent years (ASHP Drug Shortages Database, 2024). These shortages are part of a larger pattern affecting 250 essential medications in the U.S., with global counterparts like Canada and the Netherlands experiencing even broader drug shortages.
The economic and humanistic implications of these shortages are profound. They not only jeopardize patient safety but also contribute to increased healthcare costs and moral distress among healthcare providers. Understanding the demand and distribution of vinblastine through Medicaid reimbursements can provide insights into potential inefficiencies and misallocations within the healthcare system.
This study leverages Medicaid reimbursement data spanning over three decades to visualize the distribution and demand for vinblastine across different U.S. states. The project employs heatmaps to depict total and per capita reimbursement, alongside time series analysis to explore temporal fluctuations in demand. Surprisingly, a significant portion of the reimbursement data was found to be unallocated or uncategorized, raising more questions than answers regarding the accuracy and reliability of Medicaid data. This finding suggests that the Medicaid system may benefit from enhanced data collection technologies and a review of data categorization practices, which could ultimately lead to better resource allocation and improved patient outcomes.
Dataset Setup
Dataset Setup
Importing Datasets from folder/repository
Importing Datasets from folder/repository
In[]:=
ClearAll[importDemandTrends]importDemandTrends[fName_String]:= Import[FileNameJoin[{NotebookDirectory[], "DemandTrends_Medicaid_data_vinblastine", fName}], "Dataset", HeaderLines -> 1];
In[]:=
(*list all files in DemandTrends*)ClearAll[demandTrendFiles,demandTrendFileNames](*demandTrendFileNames=Map[Last,StringSplit[FileNames["*.csv", FileNameJoin[{NotebookDirectory[],"DemandTrends_Medicaid_data_vinblastine"}]],"\\"]];*)demandTrendFiles = FileNames["*.csv", FileNameJoin[{NotebookDirectory[],"DemandTrends_Medicaid_data_vinblastine"}]];demandTrendFiles//Short;
In[]:=
(* import all years into a single dataset by reading in each file and then joining together*)demandsTrendsData=Join@@(Import[#,"Dataset", HeaderLines->1]&/@ demandTrendFiles);demandsTrendsData
Out[]=


Here’s an overview of our raw dataset: It comprises data merged from 32 tables, representing each year of state Medicaid data from 1991 to 2022. The dataset includes a total of 5,977 rows and 15 columns, with detailed column descriptions provided in the data source section.
Although Medicaid was established in 1965 under Title XIX of the Social Security Act to provide healthcare services to various underserved populations, our dataset begins from 1991. This starting point coincides with significant regulatory changes, including the establishment of controls on Disproportionate Share Hospital (DSH) spending, the prohibition of provider donations, and caps on provider taxes (Provost et al., 2000). This dataset offers a fascinating glimpse into the complexities of Medicaid’s evolution and spending patterns over the years. We continue to delve deeper into the dataset to uncover more insights.
Although Medicaid was established in 1965 under Title XIX of the Social Security Act to provide healthcare services to various underserved populations, our dataset begins from 1991. This starting point coincides with significant regulatory changes, including the establishment of controls on Disproportionate Share Hospital (DSH) spending, the prohibition of provider donations, and caps on provider taxes (Provost et al., 2000). This dataset offers a fascinating glimpse into the complexities of Medicaid’s evolution and spending patterns over the years. We continue to delve deeper into the dataset to uncover more insights.
Preparing Demand Trends Data:
Preparing Demand Trends Data:
In[]:=
demandsTrendsData=demandsTrendsData[Select[#"Units Reimbursed"=!=""&]][All,<|#,"Product Name"->ToUpperCase[#"Product Name"]|>&];demandsTrendsData
Out[]=
We proceed to narrow the dataset into a subset with non-zero units reimbursed (i.e, the number of vinblastine vials that are covered and reported by the state Medicaid administrations). We are now down to 2799 rows to analyze.
Graphing Time Series
Graphing Time Series
Calculate Volume Reimbursed for all years, states, and NDCs (National Drug Codes):
Calculate Volume Reimbursed for all years, states, and NDCs (National Drug Codes):
For this particular example, the amount of vinblastine active ingredient in each vial is the same as the numeric value of package size in milligrams (mg). For each row, we multiply this value with the number of units reimbursed to get to the product volume that was covered and reported by the state Medicaid administrations. Here’s a snippet of that dataset:
In[]:=
VolumeByYear=demandsTrendsData[All,<|#,"Product Volume"(*mg*)->#"Package Size"*ToExpression[#"Units Reimbursed"]|>&];VolumeByYear[;;2]
Out[]=
We then group the rows by state and select the columns for year and product volume. Then for each state, we group observations by year, then extract the yearly product volume values.
Here’s a snippet of that resulting dataset:
Here’s a snippet of that resulting dataset:
In[]:=
VolumeByYear=VolumeByYear[GroupBy["State"],KeyTake[{"Year","Product Volume"}]];
In[]:=
VolumeByYear=VolumeByYear[All,GroupBy["Year"],Values[KeyTake[#,"Product Volume"]]&][All,All,First[Total[#]]&];VolumeByYear[[;;2]]
We then convert the state codes and year into entities that can be used for analysis and graphing later:
◼
Pulling state population information from the Wolfram database, and observe a snippet of that dataset:
◼
Replacing the state initials within the dataset to something that is recognizable as geographic entities, and review a snippet of the resulting dataset:
◼
Normalizing the years and states in the dataset
◼
Define rule for missing data, then combine and process the volume and population datasets:
Calculate the Volume Per Capita and Include It into the Dataset
Calculate the Volume Per Capita and Include It into the Dataset
Calculate the volume of vinblastine reimbursed on a per capita basis by dividing the volume by the state population, and then process to group it, and take a snippet of that resulting dataset:
◼
More code to support plotting by defining the years for graphing
Observation: Uncategorized data increased rapidly and overwhelmed the rest of the dataset from 1991 to 2022.
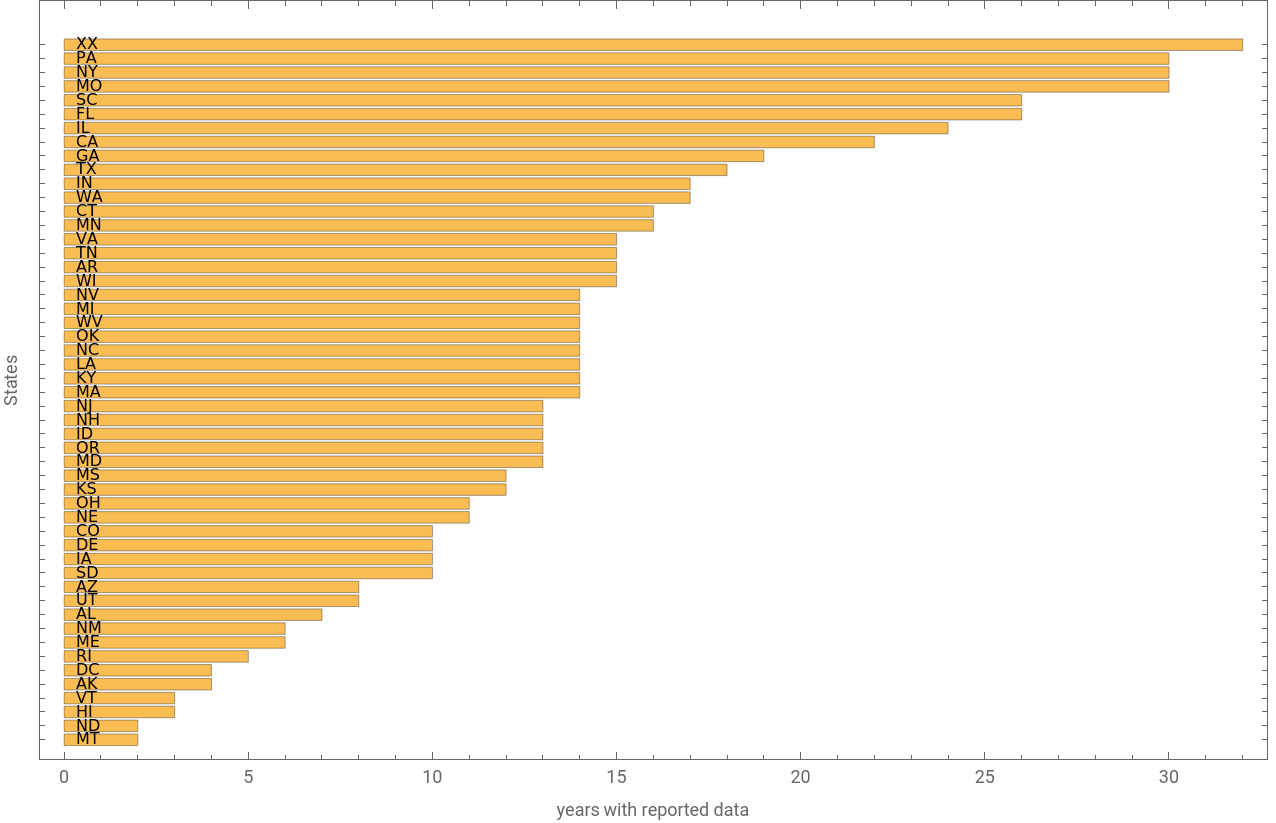
Numbers of Years of Reported State Medicaid Data (apologies for the technical difficulties)
Numbers of Years of Reported State Medicaid Data (apologies for the technical difficulties)
Visualizing the Data with Geographic Heatmaps
Visualizing the Data with Geographic Heatmaps
Observation: 1991 was the first year when Medicaid data was collected and reported at the state level in California and Florida. In 1992, other states, such as Washington, Minnesota, Missouri, New York, Pennsylvania, and South Carolina, added their datasets to the reimbursement database. There are more questions than answers about the pattern of vinblastine reimbursement as a proxy for demands for the subsequent years.
Animation omitted due to file capacity limitation. Please remove the semicolon to run it within this notebook.
Animation omitted due to file capacity limitation. Please remove the semicolon to run it within this notebook.
Concluding Remarks
Concluding Remarks
We still have more questions than answers about the reasons behind the overwhelming and increasing amount of uncategorized Medicaid reimbursement for vinblastine across the United States from 1991 to 2022.
Acknowledgments
Acknowledgments
I would like to thank my mentors, Lina, Bob, Phileas, and Chase for helping me out with learning a new programming language. I’d also like to credit Maria Sargsyan and Vlad Grankovsky for their critical input at the startup phase of the project, and Dr. Stephen Wolfram for his clarifying questions and recommendations for the future direction of this project. As Richard Feynmann once wrote, “Study hard what interests you the most in the most undisciplined, irreverent and original manner possible.” It was a pleasure to read Dr. Feynman’s “Surely You’re Joking, Mr. Feynman!” book in high school.
Data Source
Data Source
State Drug Utilization Data 1991-2022: https://data.medicaid.gov/datasets
Descriptions of Columns of State Drug Utilization Data 1991-2022: https://www.cms.gov/files/document/medicaid-state-drug-utilization-data-field-descriptions.pdf
References
References
1
.Armas, S., Huertas-Ayala, C., Chan, R. Y., Chi, Y., Huh, W. W., Termuhlen, A., Gaynon, P. S., Kovach, A. E., & Doan, A. (2022). Survival of pediatric Hodgkin lymphoma patients treated with doxorubicin, bleomycin, vincristine, etoposide, prednisone, and cyclophosphamide (ABVE-PC) versus doxorubicin, bleomycin, vinblastine, and dacarbazine (ABVD) at a single institution. Pediatric Blood & Cancer, 69(5), e29601-n/a. https://doi.org/10.1002/pbc.29601
2
.ASHP Drug Shortages Database (2024). https://www.ashp.org/drug-shortages/current-shortages
3
. Drug Shortages Canada Database (2024). https://www.drugshortagescanada.ca/
4
.FDA Drug Shortages Database (2024). https://www.accessdata.fda.gov/scripts/drugshortages/default.cfm
5
.Johnson, P. W. M. (2023). Are we reaching the maximum cure rate for Hodgkin lymphoma? Hematological Oncology, 41(S1), 57–61. https://doi.org/10.1002/hon.3140
6
.NL Times (2024). “Netherlands’ medicines shortage bigger than ever.” Available at: https://nltimes.nl/2024/01/23/netherlands-medicines-shortage-bigger-ever (Accessed: 07 July 2024).
7
.Provost C, Hughes P. Medicaid: 35 Years of Service. Health Care Financ Rev. 2000 Fall;22(1):141-174. PMID: 25372498; PMCID: PMC4194689.
8
.Santos, E. S., Oliver, T. K., Lacchetti, C., Geisel, R., Wilfong, L. S., Fader, A. N., & Eng, C. (2024). Drug Shortages in Oncology: ASCO Clinical Guidance for Alternative Treatments. JCO Oncology Practice, 20(1), 19–32. https://doi.org/10.1200/OP.23.00545
Cite This Notebook
Cite This Notebook
Hidden in plain sight: the Vinblastine reimbursement gap in Medicaid data (1991-2022)
by Phuong (Sophie) Le, Lina Marcela Ruiz Galvis, A. Chase Turner, Phileas Dazeley-Gaist, Bob Nachbar
https://community.wolfram.com/groups/-/m/t/3209918
by Phuong (Sophie) Le, Lina Marcela Ruiz Galvis, A. Chase Turner, Phileas Dazeley-Gaist, Bob Nachbar
https://community.wolfram.com/groups/-/m/t/3209918