COVID-19 US County Confirmed Cases By Population Density
Bob Sandheinrich
Bob Sandheinrich
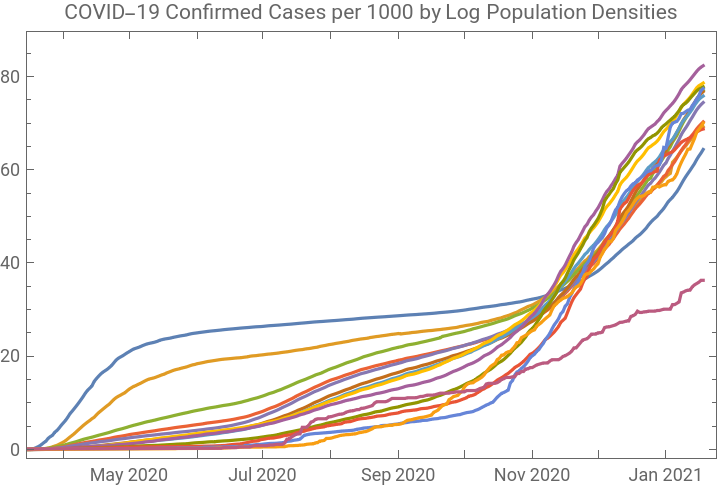
Population density is a factor in how a virus spreads. This shows how the rate of confirmed cases in US counties corresponds to the population density in those counties
Plotting COVID-19 Confirmed Cases by Population Density
Plotting COVID-19 Confirmed Cases by Population Density
Timestamp:
Style[DateString[Today],32]
Out[]=
Tue 19 Jan 2021
Import the data from the New York Times:
AbsoluteTiming[coviddata=ResourceFunction["NYTimesCOVID19Data"]["USCountiesTimeSeries"];]
Out[]=
{95.8631,Null}
Split the counties into groups based on the Log of their population density. This can be very slow:
AbsoluteTiming[bydensity=coviddata[ResourceFunction["KeyGroupBy"][Round[Log[QuantityMagnitude[#["PopulationDensity"]]]]&]];]
Out[]=
{563.864,Null}
Check the keys. The integers here represent the rounded Log of the population density (in people/square mile), notice that some counties had no density data, eliminate them:
Keys[bydensity]
Out[]=


In[]:=
bydensity=bydensity[KeySelect[IntegerQ]];
Create the plot. There is a lot going on here. I add a zero point to each time series at March 1, to avoid an issue with counties that have not reported any cases. For each population density bucket I total the confirmed cases and divide it by the total of all the populations (then multiply by a thousand to give a nicer scale). Then I sort the keys and plot them all together:
bydensityKeySort/*Reverse/*KeyMap[ToString]/*DateListPlot#,&,1000*Total[Values[#]]Total[QuantityMagnitude[EntityValue[Keys[#],"Population"]]]&,TimeSeriesInsert[#Cases,{DateObject["March 1, 2020"],0}]&
Out[]=


Get the latest raw values:
bydensity[KeySort/*Reverse,1000*Total[Values[#]]["LastValue"]/Total[QuantityMagnitude[EntityValue[Keys[#],"Population"]]]&,TimeSeriesInsert[#Cases,{DateObject["March 1, 2020"],0}]&]
Out[]=
Keywords
Keywords
◼
COVID-19
◼
Coronavirus
◼
Epidemiology
◼
Pandemic
◼
Geographic Data
◼
Timelines