Phasor and Temporal Diagrams in Electrical Power-System Fault Analysis
Phasor and Temporal Diagrams in Electrical Power-System Fault Analysis


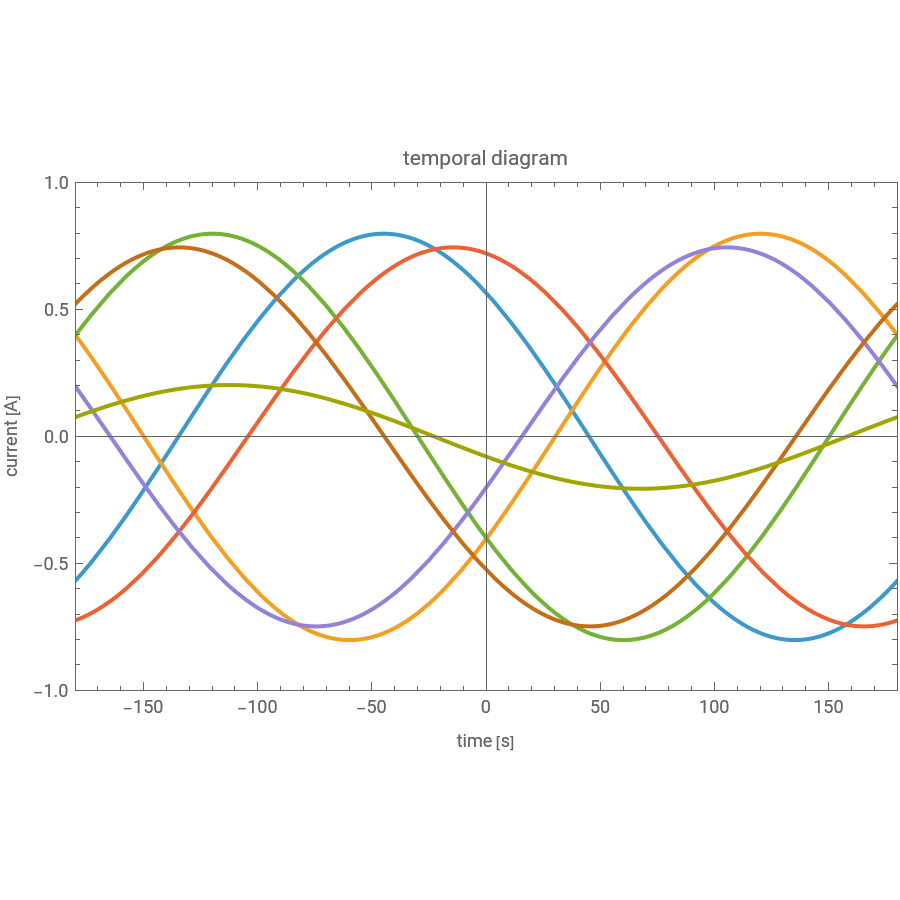
This Demonstration uses phasor and temporal diagrams to show the effect of symmetric and asymmetric faults in a three-phase system.
A temporal diagram shows the signals in cosine form, in which it is difficult to analyze the effect of a fault in an electrical system. In such cases, the phasor diagram helps the analysis. A phasor diagram represents the cosine wave frequencies as a vector.
The symmetric decomposition of phases A, B, and C shows the effects caused in symmetrically equivalent circuits (in positive, negative, and zero sequences).
References
References
[1] W. D. Stevenson, Jr., Elements of Power System Analysis, 3rd ed., New York: McGraw–Hill, New York, 1975.
[2] B. Mirafzal, "Power Systems (III)." (Sep 2011)
[3] J. R. Lucas, "EE 423—Power Systems Analysis." (Sep 2011) http://www.elect.mrt.ac.lk/EE423_%20Fault_Analysis_Notes.pdf.
[4] "Protection Basics: Introduction to Symmetrical Components." (Sep 2011) http://www.gedigitalenergy.com/smartgrid/Dec07/7-symmetrical.pdf.
External Links
External Links
Permanent Citation
Permanent Citation
Daniel Motter, Daniel Motter
"Phasor and Temporal Diagrams in Electrical Power-System Fault Analysis"
http://demonstrations.wolfram.com/PhasorAndTemporalDiagramsInElectricalPowerSystemFaultAnalysi/
Wolfram Demonstrations Project
Published: September 20, 2011