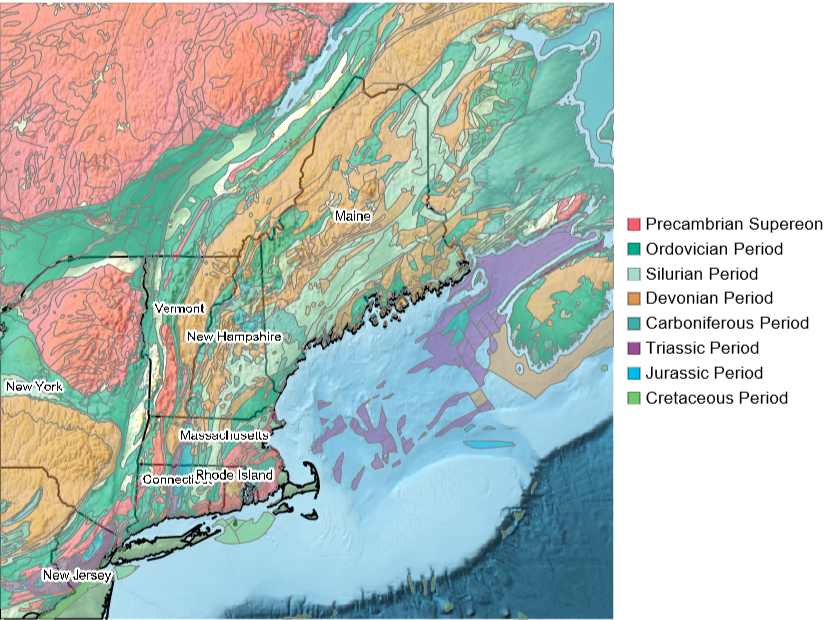
If you look at a geological map of New England in the United States, you will notice alternating bands of color. The different colors correspond to bedrock of different ages. The oldest rock is pink in color and is ancient billion year old Precambrian rock. These represent the ancient coast of North America about 1 billion years ago. As you move generally east and northeast in New England, things start to change. The rock is much younger, over 500 million years younger! Why is the structure so banded? What happened to the ancient northeast coast that resulted in this?
geoElement[ent_Entity,opacity_]:={GeoStyling[#[[1]],Opacity[opacity],EdgeForm[Gray]],Tooltip[#[[2]],#[[3]]]}&@ent[{"CGMWColor","BedrockPolygon","Name"}];states=,,,,,,,,,,,,,;politicalBoundaries={EdgeForm[{Black,Thickness[.003]}],FaceForm[],Polygon/@states};labels={Haloing[],Text[StringReplace[#["Name"],", United States"->""],#,{0,-2}]&/@states};periods=,,,,,,,;With{o=.5},LegendedGeoGraphics{politicalBoundaries,geoElement[#,o]&/@periods,labels},GeoCenter->,GeoRange->Quantity[300,"Miles"],GeoBackground->"ReliefMap",ImageSize->600,SwatchLegend@@Transpose[EntityValue[periods,{"CGMWColor","Name"}]]
Out[]=
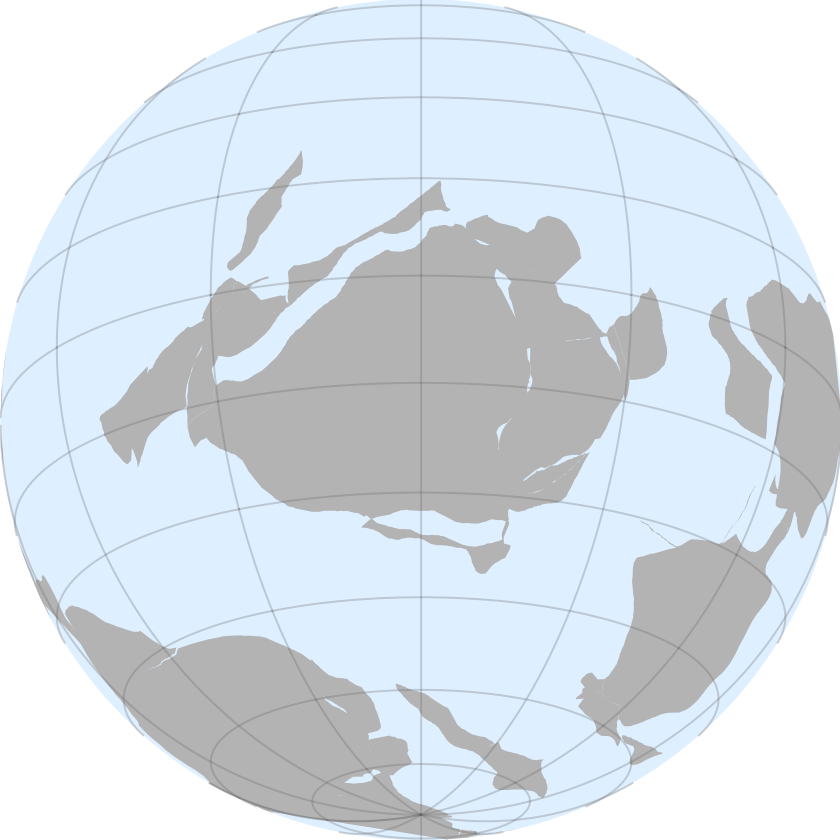
During the Ordovician Period, modern day North America (and New England) was different than today. It wasn’t complete, was in a different place and it was oriented differently. The core of modern North America was called Laurentia and was just south of the equator and rotated so that the modern east coast was facing south. It is illustrated below with Laurentia nearly center. The large landmass near the south pole was called Gondwana. The small sliver of land to the right of Gondwana was a micro-continent known as Avalonia that had rifted off of Gondwana earlier in the Cambrian Period. Closer to Laurentia, off the modern East coast and ancient south coast, was a chain of volcanic islands. The volcanic islands were known as the Taconic volcanic island chain and formed on the back side of a subduction zone that was off the coast. As subduction continued, the oceanic basin between Laurentia and Gondwana shrank and brought the Taconic islands closer to Laurentia.
In[]:=
ResourceFunction["ContinentalPlateMaps"],GeoProjection->{"Orthographic","Centering"->{-20,-60}}[DateObject[{-480000000},"Year"]]
Out[]=
Each of the bands of different age rock seen in the bedrock map above is what is known as an exotic terrane. Exotic terranes involve the formation of land with its own geologic history and transporting it to another location to then be sutured onto rock with a different geologic history.
Before we go into more detail about the events leading to the geology of New England, its better to explore different data.
Relief Maps
Relief Maps
A year ago I explored a set of data from C.R. Scotese (https://community.wolfram.com/groups/-/m/t/2828058). This data set provides a bit more detail of the continental arrangement of the ancient Earth with 6 arcminute resolution globally, although the data is pixel-based rather than vector/polygon based and the memory footprint of all the data is a fair amount larger. I leave it to the reader to follow the link above to obtain the data.
As above, lets explore the world as it was 480 million years ago, near the beginning of the Ordovician Period.
In[]:=
SetDirectory[NotebookDirectory[]<>"Scotese_Wright_2018_Maps_1-88_6minX6min_PaleoDEMS_nc\\"];
In[]:=
cdf=Import["Map82_PALEOMAP_6min_Early_Ordovician_480Ma.nc","Data"];
In[]:=
data=Normal[cdf["/z"]];
In[]:=
ri=ReliefImage[data,PlotRange->{-500,4500},ClippingStyle->{Automatic,White},ColorFunction->ColorDataFunction["HypsometricTints","Physical",{-11000,9000},Blend["HypsometricTints",#1]&],ColorFunctionScaling->False,ImageSize->600]
Out[]=
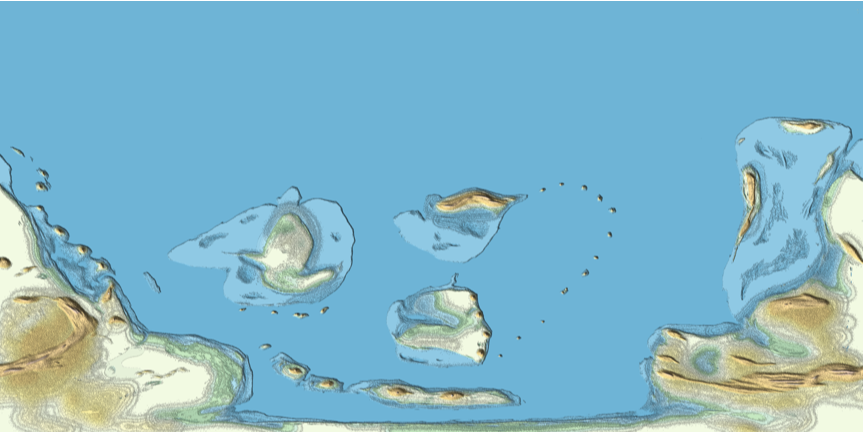
As a post-processing step, I performed a BSlineFunction operation on the data files to smooth out some of the noise and rough areas. I use the results of that instead of the direct ReliefMap shown above. Regardless of whether you use ReliefMap of the raw data directly or a BSplineFunction-smoothed version, the result is an image you can use as a texture in GeoGraphics to obtain other geo projections.
bsp=BSplineFunction[Map[List,#,{2}],SplineDegree->100,SplineClosed->{False,True}]&/@data;
In[]:=
intBSP[x_,y_,bspd_]:=bspd[x/1801.,y/3601.][[1]]
I then performed a Do loop to construct a new data set from the spline operation with an operation like:
Do[intdata=Table[N@intBSP[x,y,bsp[[i]]],{x,1.,1801.},{y,1.,3601.}];ri=ReliefImage[intdata,PlotRange->{-500,4500},ClippingStyle->{Automatic,White},ColorFunction->ColorDataFunction["HypsometricTints","Physical",{-11000,9000},Blend["HypsometricTints",#1]&],ColorFunctionScaling->False];Export["Splines\\Better\\"<>ToString[PaddedForm[ages[[i]],3,NumberPadding"0",NumberSigns{"",""}]]<>".png",ri],{i,46,Length[bsp],1}];
After processing the data to smooth it a bit, I generated new ReliefImage results and exported those out to a directory called Splines and saved each one to a PNG file with the age as the file name. This took awhile, but resulted in slightly less noisy results.
Here I show an orthographic projection of the world as it appeared at the beginning of the Ordovician Period, 480 million years ago.
In[]:=
texture=Import["Splines\\480.png"];
In[]:=
GeoGraphics["World",GeoBackground->GeoStyling[{"GeoImage",texture}],GeoProjection->{"Orthographic","Centering"->{-20,-60}},GeoGridLines->Automatic]
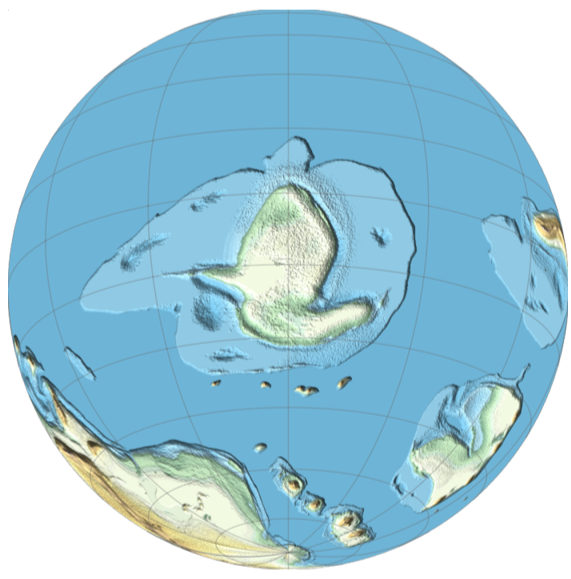
The above view shows a bit more detail than the vector version in the earlier section. The Taconic island chain is easier to see off the ancient south coast (modern east coast) of Laurentia. Also, this view shows the effects of a higher sea level. Most of Laurentia was covered by a shallow sea.
Now let’s jump 30 million years later to the late Ordovician Period. The Taconic island chain has collided with the south coast (modern east coast) and resulted in a mountain building episode called the Taconic Orogeny. This event affected the New England and Eastern Canadian regions creating the earliest phases of the Appalachian mountain chain. Also, as a result of the Taconic islands colliding with Laurentia, it grew a bit larger as those islands were sutured onto the growing continent.
Notice that we can see another chain of islands to the south of Laurentia. These are a bit bigger than the Taconic island chain from before. This is the micro-continent of Avalonia. If we jump ahead another 25 million years we can see Avalonia also collide and suture itself onto the ancient southern coast (modern east coast). This creates another mountain building event known as the Acadian Orogeny and was more significant since the collision was more significant than the Taconic Orogeny. The early Appalachian Mountains grew even more and the ancient southern coast (modern east coast) grew even more.
Further evidence of exotic terranes being sutured onto the modern east coast of the United states can be seen further south in Virginia and the Carolinas. In these areas the nearly continuous pink band of Precambrian rock is the Blue Ridge Mountains. East and southeast of the Blue Ridge Mountains we can see nearly parallel bands of rock that are slightly younger in age (mostly Cambrian). Compared to New England, most of the rocks east of the mountains are a bit older including Cambrian and even more Precambrian rock and not nearly as much Ordovician, SIlurian and Devonian rocks. This implies that the terranes that were sutured on here were formed earlier during late Precambrian and Cambrian time (elsewhere), but docked with Laurentia later in the Paleozoic Era. Perhaps this was a chunk of older continental crust that rifted away from Gondwana rather than a young volcanic island arc.
In addition to the Cambrian and Precambrian rock that was sutured onto the Carolinas and Virginia, we can notice the purple, light blue, and light green colors of Mesozoic Era rocks that formed when Pangea started to rift apart forming volcanic intrusions during this time period. These colors show the early formation of the Atlantic Ocean. Areas along the coast are much younger and mostly formed from erosion of the older rock further west.
Animation
Animation
Retrieve the relevant file names from the pre-generated and smoothed raster images from earlier:
Extract the age of each file as a string:
Since Laurentia moves around over the course of time, create interpolating functions for the latitude and longitude to center on:
Import the actual images and apply them as textures using GeoGraphics:
Export the frames as a video file:
CITE THIS NOTEBOOK
CITE THIS NOTEBOOK
Exotic terranes of the United States east coast
by Jeff Bryant
Wolfram Community, STAFF PICKS, February 26, 2024
https://community.wolfram.com/groups/-/m/t/3130881
by Jeff Bryant
Wolfram Community, STAFF PICKS, February 26, 2024
https://community.wolfram.com/groups/-/m/t/3130881