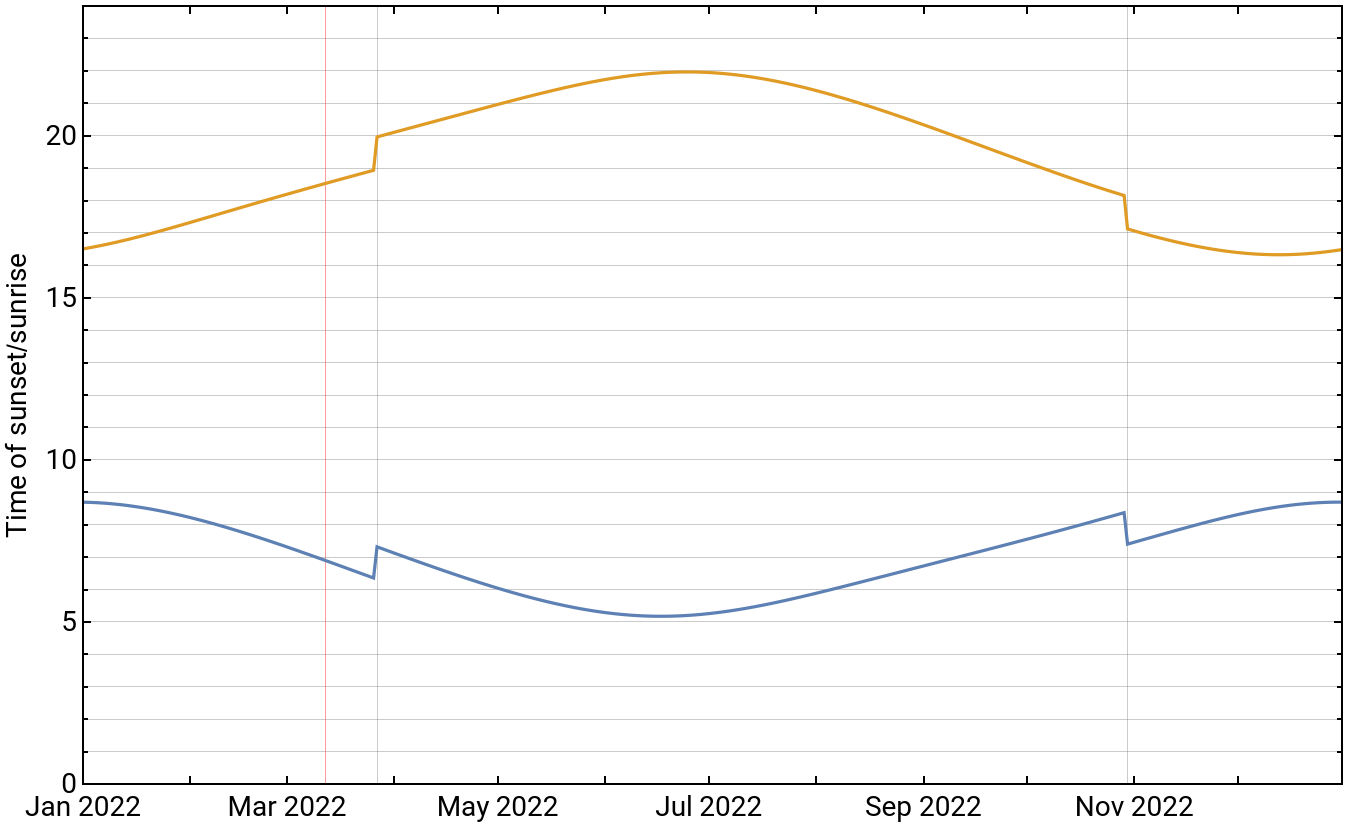
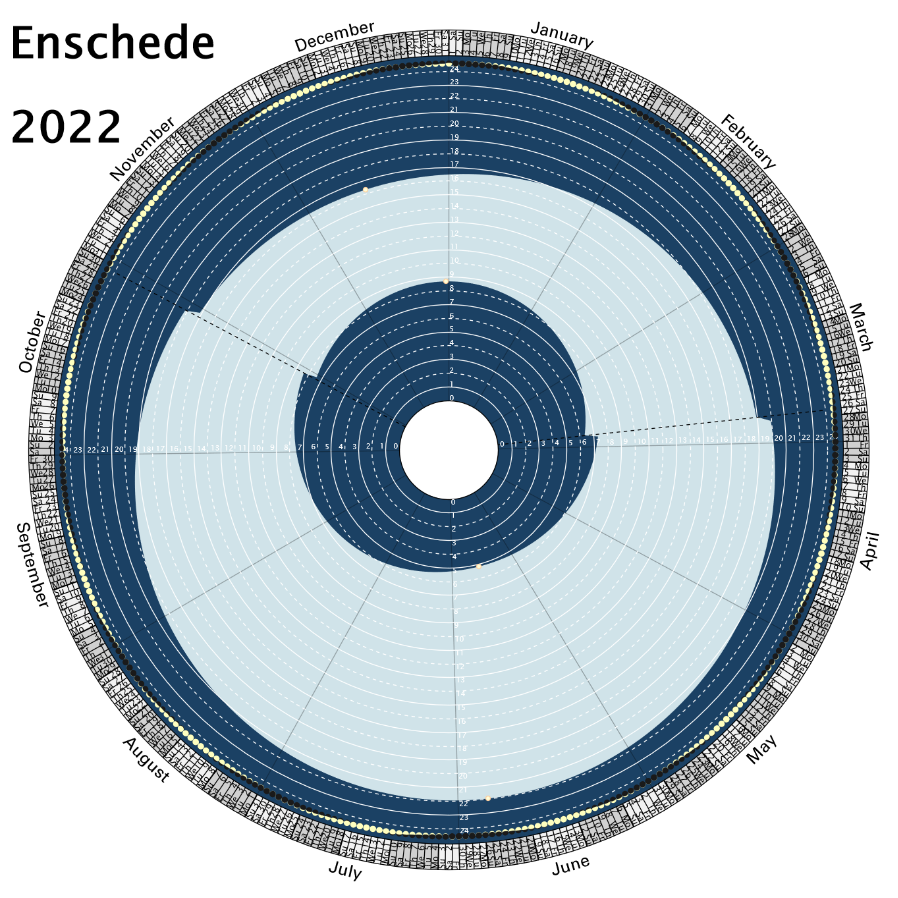
Based on the sunset/sunrise charts you can find here and here I thought: let’s make a circular sunrise/sunset chart in Mathematica. The data can be accessed by Sunset and Sunrise functionality. But I modified the function to get the unrounded values. Of interest are the days for which the sun rises the earliest/latest, and days for which the sun sets earliest/latest, but also the moon phases, and when daylight-saving time starts and stops. The final product can then be exported as a PDF to print. Note that I did not fully test all the code for all geographical location. It will probably have an issue when there is no sunrise/sunset during a day (up very north or down very south).
In[]:=
SetDirectory[NotebookDirectory[]];$HistoryLength=1;location=;(*setthelocation*)tz="Europe/Amsterdam";(*whichtimezone*)locationname="Enschede";(*nameoftheloocationfordisplayingpurposes*)year=2022;(*whichyear*)dotwnames={Monday"Mo",Tuesday"Tu",Wednesday"We",Thursday"Th",Friday"Fr",Saturday"Sa",Sunday"Su"};(*whichdayoftheweeek*)dates=DateRange[{year,1,1},{year,12,31}];datesmiddday=ReplacePart[#,4->12]&/@dates;len=Length[dates];pos=GeoPosition[location];offsets=Mean[TimeZoneOffset[tz,#]]&/@dates;offsetsmidday=Mean[TimeZoneOffset[tz,#]]&/@datesmiddday;tzc=Flatten[Position[Abs[Differences[offsetsmidday]],1]];(*finddaylightsavingstuff*)timezonechanges=Table[newdates=ReplacePart[dates[[t+1]],4->#]&/@Range[-1,25];vals={#,Mean@TimeZoneOffset[tz,#]}&/@newdates;vals=GatherBy[vals,Last];Switch[Length[vals],2,vals[[2,1,1]],3,vals[[2,-1,1]],_,Mean[Catenate[vals][[All,1]]]],{t,tzc}];PrintTemporary[Dynamic[dti]];(*getnon-roundedSunriseandSunsetdata*)sunsetrisedata=Table[dt=dates[[dti]];tr=Trace[Sunrise[pos,dt[[;;3]],TimeZoneoffsetsmidday[[dti]]],{y___,Round[x_]}:>{y,x},TraceOriginalTrue];tr//=ReleaseHold/*Flatten;tr=tr[[-5;;]];sr={tr[[;;3]],tr[[4]]+tr[[5]]/60};tr=Trace[Sunset[pos,dt[[;;3]],TimeZoneoffsetsmidday[[dti]]],{y___,Round[x_]}:>{y,x},TraceOriginalTrue];tr//=ReleaseHold/*Flatten;tr=tr[[-5;;]];ss={tr[[;;3]],tr[[4]]+tr[[5]]/60};{dt,sr,ss},{dti,Length[dates]}];sr={sunsetrisedata[[All,1]],sunsetrisedata[[All,2,2]]}//Transpose;ss={sunsetrisedata[[All,1]],sunsetrisedata[[All,3,2]]}//Transpose;smf=MoonPhase[Replace[#,{4->23,5->59,6->59}],"SignedFraction"]&/@dates;(*getsignedmoonphases*)DateListPlot[{sr,ss},ImageSize800,FrameLabel{None,"Time of sunset/sunrise"},FrameStyleDirective[14,Black,AbsoluteThickness[1]],PlotRange{All,{0,24}},PlotRangePadding0,GridLines{timezonechanges//Append[{Today,Red}],Range[0,24,1]}]
Out[]=
In[]:=
Out[]=
In[]:=
Export[StringReplace[locationname<>"_"<>DateString[Now,"ISODateTime"]<>".pdf",":"|"-"->""],gr,"AllowRasterization"->False]
Out[]=
Enschede_20220312T202344.pdf