This project had the objective to characterize the trade-offs of different fitness functions related to the features of cellular automata we found. Exploring shape-based fitness functions as well as sequence-based ones, the former mostly being positively correlated and the latter containing cases with genuine trade-offs. The sequence-based case therefore had distinct Pareto frontiers, providing a minimal model for trade-offs in real-world scenarios. Because of the model’s simplicity, in future work, we can study exactly how objectives interact with each other.
Introduction
Introduction
The use of multi-objective optimization in this projects helped use to characterize trade-offs between fitness functions related to the features of the cellular automata (CA). By utilizing the CA based evolutionary algorithm that the behavior of CAs provide we can run multiple evolutions to do an extensive search of the solution space, so we can find the most optimal solutions that are non-trivial or don’t converge to a single solution, and form a non-dominated front called the Pareto frontier. Our goal is to characterize possible fitness functions that give us the non-correlated behavior that can lead us to plot a Pareto frontier. Ultimately, understanding this optimization behavior helps us assess how well these evolutionary approaches can be applied to complex, real-world multi-objective problems.
A minimal model of biological evolution
A minimal model of biological evolution
The cellular automata model of biological systems allows us to understand better how a single agent with a simple set of rules can have a complex behavior and evolve to reach certain fitness, like how species adapt to their environments through natural selection. By defining an objective function, one can direct the CAs evolution toward a certain fitness value, with each successive generation it mutates it the rules that defines its “genotype” allowing it to find a higher fitness-value than the last generation.
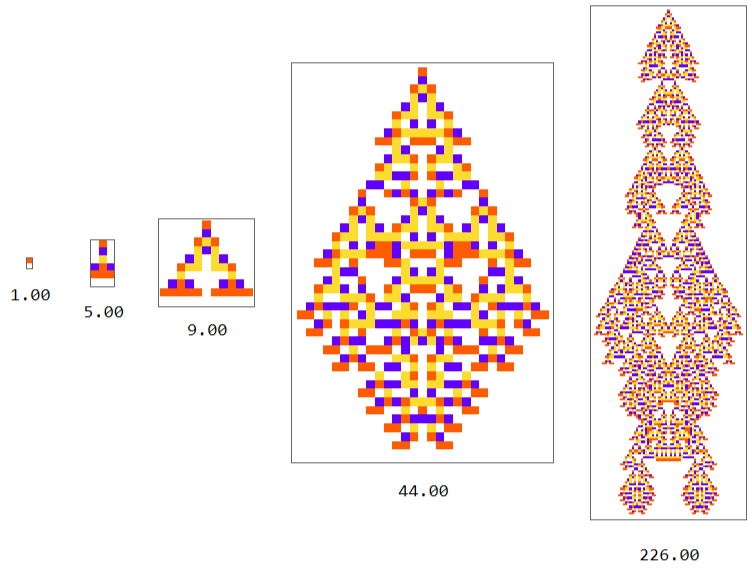
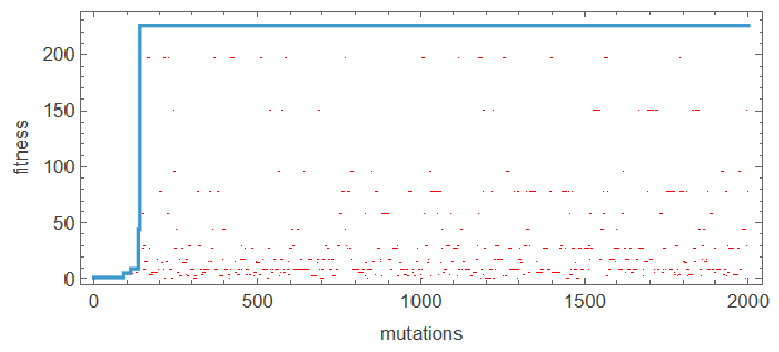
As an example, if the objective is defined as maximizing the automaton's lifetime it can be observed how in each generation it has a longer and more complex pattern, this was a result of multiple mutations where the ones with the best fitness values persisted and the other ones where rejected by natural selection.
The adaptive evolution optimization algorithm
The adaptive evolution optimization algorithm
Instead of how a genetic algorithm initializes with a population of different possible solutions, the CA based algorithm does one evolution at-a-time changing the seed in each iteration and looking for the one with the best fitness value and the best rule, it does this based on elitist selection since it rejects the offspring or the parent based on if they perform worse in the defined objective. It could be considered asexual reproduction of the organism since it relies only in mutation and a kind of elitist selection of the most optimal or fitting offspring.
Out[]=
CA based evolutionary algorithm | Genetic algorithm |
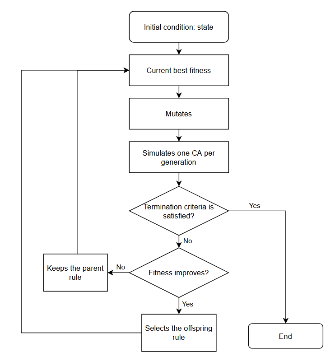
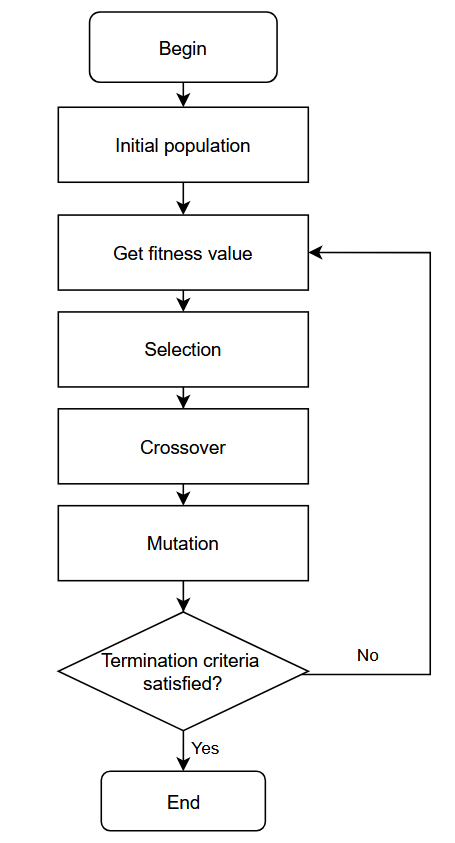
A CA rule is expressed as a large integer, it encodes a lookup table which specifies an output color for every possible neighborhood configuration. In the mutation step a random position of the subset of rules is selected and the integer value changes. The number of positions changed decreases as the fitness-value increases, so mutations become progressively smaller and more conservative as the automaton approaches a fitter state.
Multi-objective optimization (MOO)
Multi-objective optimization (MOO)
Multi-objective optimization is used when there is a trade-off between two or more objective functions, that is, when one attempts to optimize for different criteria simultaneously, and improving one typically affects the other. Rather than a single optimal solution, the result of this optimization is a set of non-dominated solutions known as the Pareto frontier.
A solution point is rejected as a non-dominated solution if some other solution in the population matches or exceeds it on every objective and strictly surpasses it on at least one. The solutions that no other point dominates (non-dominated front) constitutes the Pareto frontier, the set of best possible trade-offs, where improving one objective further is only possible at the expense of another.
There is a strict dominance clause in the definition that doesn’t allow two points to dominate each other. A point gets discarded if some other point matches or beats it everywhere and is strictly ahead somewhere.
In[]:=
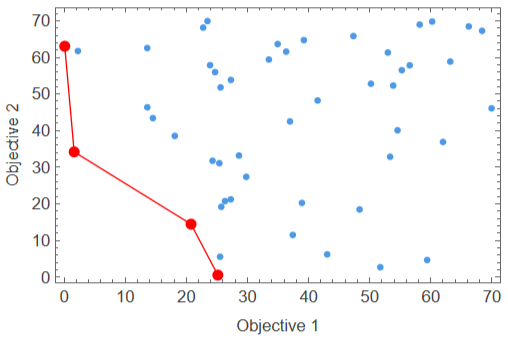
The image above is an example of a Pareto frontier formed from a random set of points where it minimizes both objectives.
Implementing MOO in CAs
Implementing MOO in CAs
Optimizing for features of the automata
Optimizing for features of the automata
To start we tested different fitness functions related to simple features of the CA, like length, width and the count of red and blue cells, the objective was to see how much the optimization improves as we changed the fitness function and if optimizing for two variables at the same time is better than just one.
In[]:=
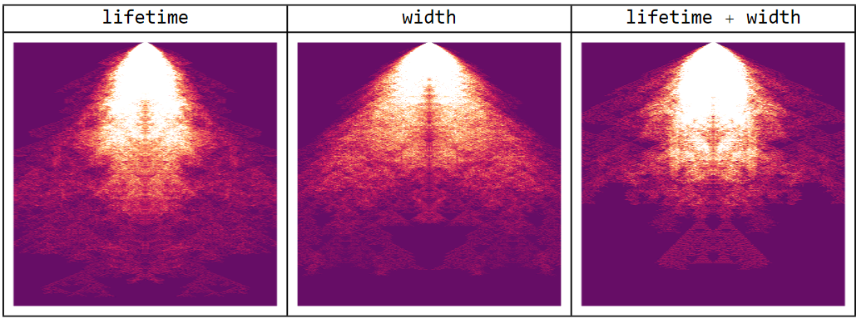
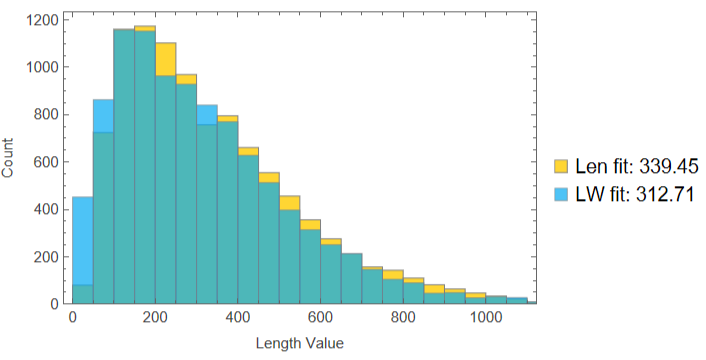
The histograms compare how well each of the evolutions performs in both of the fitness functions, its seen that in the single objective optimizations the cellular automata does a better job at finding farther values of length and width .
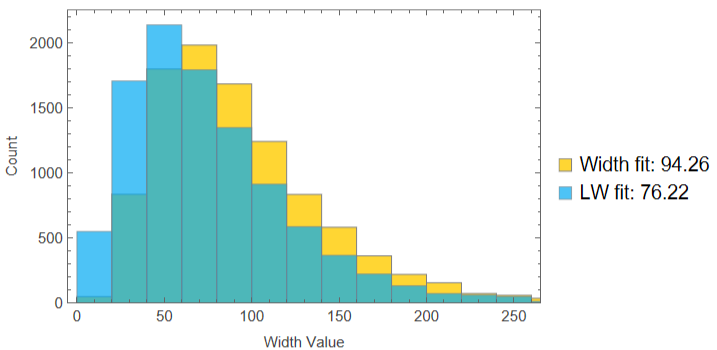
Since the comparison between the length and width objectives led to a somewhat trivial solution where the increase of the length of the CA by default makes easier the increase of width, we also tried looking at the color count of cells in the cellular automata, in this case the red and blue cells.
We used the weighted-sum method to run multiple simulations with the same fitness functions and different weights, this allows us to get a complete look at the solution space. This method is usually not recommended if the solution population has no convex form, in this case it was a good option since most of the dominance test converge to a single point.
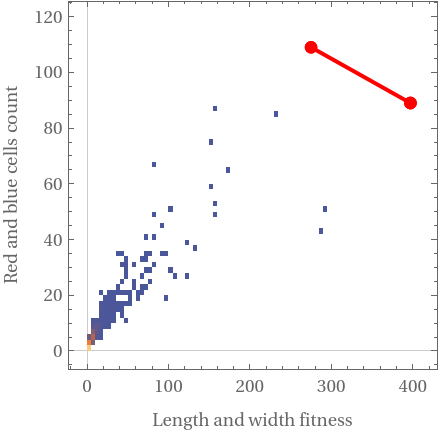
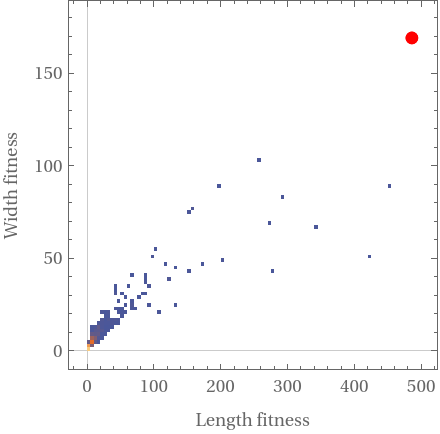
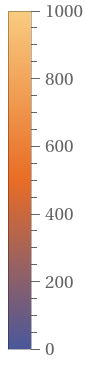
The results of this simulations with color counts also show a trivial behavior, which can be seen in the plots above, where the non-dominated front has a maximum of two points, meaning that there’s a large correlation between the variables being evaluated. The orange point at the origin represents the large number of points that couldn’t reach a good fitness value.
The multi-objective evolution method used converges to a single solution resulting in a really small Pareto frontier. The colors variable refers to the count sum of the red and blue cells.
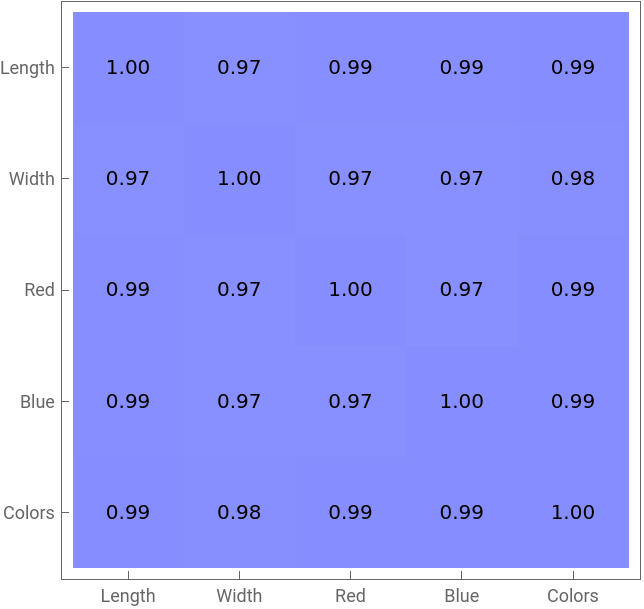
The next part of the project was looking for better variables with real trade-offs that will result in a complete Pareto frontier.
Optimizing for different patterns
Optimizing for different patterns
In what we did previously our fitness functions were based on the overall shape of the pattern, but we can also use fitness functions that are based on specific regions within the cellular automata.
Match a certain sequence
Match a certain sequence
First we tried to evolve them to match two different sequences at the same time, one horizontal sequence an a vertical one with very simple sequences there was a Pareto frontier that wasn’t really strong.
After running a bigger amount of evolutions we could see a larger Pareto frontier.
It’s possible to see how most of the evolutions get stuck on certain range of values, this shows how hard it is for this method to find the best solutions. On the z-axis we are showing the number of rules that ended up with those fitness-values.
It is possible to add another objective function to the evolution, which leads us to find a 3D plot of the possible solutions. The increase of points in the Pareto frontier is caused by the small correlation between the variables evaluated.
After running the 3 objective optimization we are able to test the dominance of the best possible solutions.
Match a pattern inside the CA
Match a pattern inside the CA
Finally we tried to make the CA match different patches of color in the pattern at the same time. After running 1000 simulations and binning the results we can calculate the correlation matrix between the data of different objectives. This results tells us how effective multi-objective optimization is since there’s real trade-off between objectives. The plot is gonna show multiple non-dominated points.
This are the results with the best fitness value, meaning that they have reached or are close to the pattern specified by the fitness function.
Now that we have 3-objective fitness function, we can find the best solutions in the 3 dimension fitness comparison plot.
Next Steps
Next Steps
For future work I would like to focus more on how the algorithm can be used in real-life problems of parameter optimization of multiple objectives, I would like to test it on existing multi-objective problems in engineering settings. Continue to explore the behavior of CA based evolutionary algorithms and their constraints and increase the amount of objectives evaluated.
Code
Code
Concluding Remarks
Concluding Remarks
Optimizing at the same time variables directly related to the features of the cellular automata leads us to a trivial result, since all the variables evaluated showed a complete correlation in the correlation matrix, almost 1 in all of the values. When the lifetime increased it’s easier for the automata to get wider and it gets more complex patterns so the amount of colored cells also increase. There is no use of multi-objective optimization in this cases, since all the results are going to converge to a single point meaning that there’s just one optimal solution in the whole set or a really mild Pareto frontier that doesn’t show real trade-off between objectives. With this result we can conclude that feature related variables of the cellular automata are not viable to use for multi-objective optimization and we can instead do single-objective optimization in each of them.
To create cases in which multi-objective optimization is useful we used fitness functions that forced the cellular automata to match certain patterns, like sequences and patches of color inside the automata. After the simulation it was possible evaluate the correlation between fitness values which confirmed the viability of using multi-objective optimization. This objectives showed real trade-off in their behavior, the resulting plot showed a larger Pareto frontier. At the same time most of this results show that there are a lot of mutations that get stuck to a certain value. That could mean that there’s kind of a sensitivity to initial conditions, or that this kind of algorithm can’t reach the global solutions if there are not enough mutations.
To create cases in which multi-objective optimization is useful we used fitness functions that forced the cellular automata to match certain patterns, like sequences and patches of color inside the automata. After the simulation it was possible evaluate the correlation between fitness values which confirmed the viability of using multi-objective optimization. This objectives showed real trade-off in their behavior, the resulting plot showed a larger Pareto frontier. At the same time most of this results show that there are a lot of mutations that get stuck to a certain value. That could mean that there’s kind of a sensitivity to initial conditions, or that this kind of algorithm can’t reach the global solutions if there are not enough mutations.
Acknowledgements
Acknowledgements
First, I would like thank my mentor, Willem Riley Nielsen, for his patience and dedication to help me fulfill the project. Then, I would like to thank Dr. Stephen Wolfram for the main idea of this project. Finally, I would like to thank the banana cake of the dinning hall for being there for me at my worst moments.
References
References
1
.T. Bäck and H. -P. Schwefel, “An Overview of Evolutionary Algorithms for Parameter Optimization,” in Evolutionary Computation, vol. 1, no. 1, pp. 1-23, March 1993, doi: 10.1162/evco.1993.1.1.1.
2
.C. Doerr and J. Lengler, “The (1+1) Elitist Black-Box Complexity of LeadingOnes,” 2016, arXiv preprint arXiv:1604.02355. [Online]. Available: https://arxiv.org/abs/1604.02355
3
.Albadr, Musatafa & Tiun, Sabrina & Ayob, Masri & Al-Dhief, Fahad. (2020). Genetic Algorithm Based on Natural Selection Theory for Optimization Problems. Symmetry. 12. 1-31. 10.3390/sym12111758.
4
.Z. Jiang, Z. Li, and Z. Yao, “Multi-Objective Optimization in 3D Floorplanning,” Electronics, vol. 13, no. 9, p. 1696, 2024. [Online]. Available: https://doi.org/10.3390/electronics13091696
5
.Deb, K. (2011). Multi-objective Optimization Using Evolutionary Algorithms: An Introduction. In: Wang, L., Ng, A., Deb, K. (eds) Multi-objective Evolutionary Optimization for Product Design and Manufacturing. Springer, London. https://doi.org/10.1007/978-0-85729-652-8_1
AI Disclosure
AI Disclosure
The following generative AI tools were used in this project: Claude: Sonnet 5 and Gemini: 3.5 Flash. They were used for brainstorming, literature review, debugging code and editing prose. All code and written content was reviewed, understood and approved by the author.
CITE THIS NOTEBOOK
CITE THIS NOTEBOOK
Limits of Multi-Objective Adaptive Evolution for Cellular Automata
by Laura Perilla
Wolfram Community, STAFF PICKS, July 16, 2026
https://community.wolfram.com/groups/-/m/t/3762800
by Laura Perilla
Wolfram Community, STAFF PICKS, July 16, 2026
https://community.wolfram.com/groups/-/m/t/3762800