In[]:=
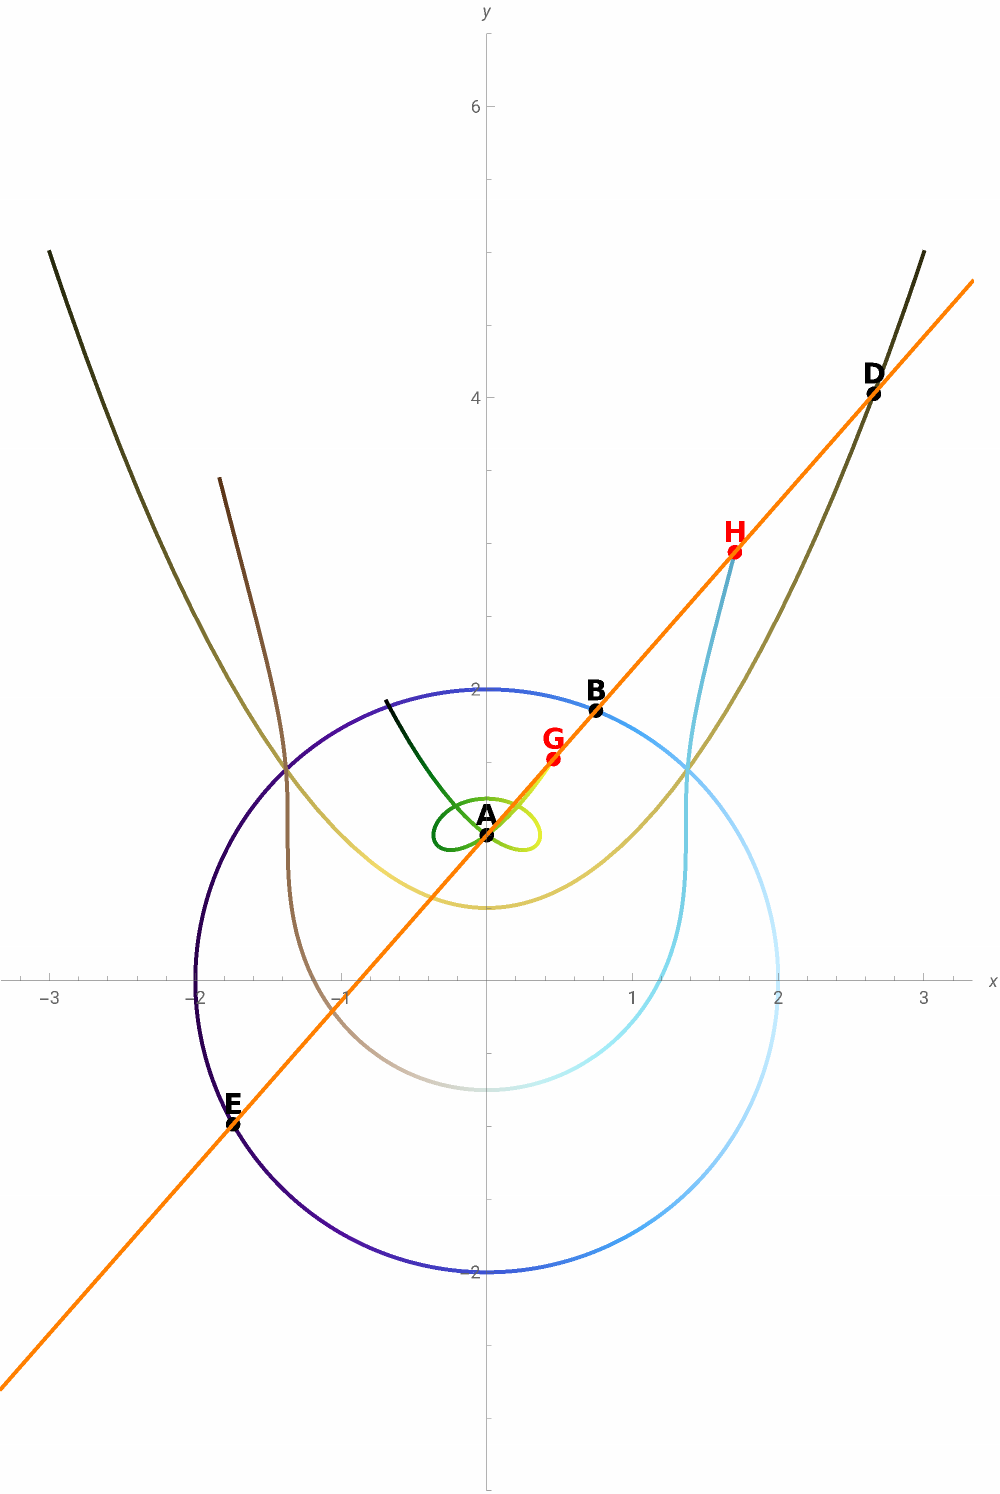
GeometricLocusSymbolicProblem::usage="D ϵ Ρ, ⋂ = {E, B}. Find the geometric locus of G = MID(D, E) andH = MID(D, B), knowing that : + = 4, Ρ: y = +1, focus: A{0, 1}, directrix: y = 0.References: Internet, Facebook: A Beautiful Locus Problem with a Circle and a Parabola; Personal.";
AD
2
x
2
y
2
x
2
Development:
Point D:
In[]:=
t,+1;
2
t
2
Direction vector of :
AD
In[]:=
D-A==t,+1-1==t,-1;
2
t
2
2
t
2
Any point on the line:
AD
ℒ: {0, 1} + λ ;
t,-1
2
t
2
Obtaining the points E and B which are the intersection with the circle of the line :
AD
In[]:=
λt,1+λ-1;+==4;Solve+==4,λ;
2
t
2
2
(λt)
2
1+λ-1
2
t
2
2
(λt)
2
1+λ-1
2
t
2
In[]:=
λ,λ;
21--2
2
t
1++
2
t
4
t
1+2+
2
t
4
t
21-+2
2
t
1++
2
t
4
t
1+2+
2
t
4
t
In[]:=
D1[t_]:=t,+1;B[t_]:=t,1+-1;E1[t_]:=t,1+-1;//FullSimplify;//FullSimplify;
2
t
2
21-+2
2
t
1++
2
t
4
t
1+2+
2
t
4
t
21-+2
2
t
1++
2
t
4
t
1+2+
2
t
4
t
2
t
2
21--2
2
t
1++
2
t
4
t
1+2+
2
t
4
t
21--2
2
t
1++
2
t
4
t
1+2+
2
t
4
t
2
t
2
D1[t]+E1[t]
2
D1[t]+B[t]
2
In[]:=
,3+-;
t3+-4
4
t
1++
2
t
4
t
2
2
(1+)
2
t
1
4
2
t
2(-1+)-1++2
2
t
2
t
1++
2
t
4
t
2
(1+)
2
t
In[]:=
,3++;
t3++4
4
t
1++
2
t
4
t
2
2
(1+)
2
t
1
4
2
t
2(-1+)1-+2
2
t
2
t
1++
2
t
4
t
2
(1+)
2
t
Animation:
In[]:=
ManipulateA={0,1};D1[t_]:=t,+1;B[t_]:=t,1+-1;E1[t_]:=t,1+-1;G[t_]:=,3+-;H[t_]:=,3++;ShowParametricPlot[{2Cos[t],2Sin[t]},{t,0,2π},ColorFunction->"DeepSeaColors"],ParametricPlott,+1,{t,-3,3},ColorFunction->"BrassTones",ParametricPlot[G[t],{t,-3,t1},ColorFunction->"AvocadoColors"],ParametricPlot[H[t],{t,-3,t1},ColorFunction->"BrownCyanTones"],Graphics[{Black,PointSize[0.015],Point[A],Text[Style["A",14,Bold],A,{0,-1.2}],Point[D1[t1]],Text[Style["D",14,Bold],D1[t1],{0,-1.2}],Point[B[t1]],Text[Style["B",14,Bold],B[t1],{0,-1.2}],Point[E1[t1]],Text[Style["E",14,Bold],E1[t1],{0,-1.2}],{Red,Point[G[t1]],Text[Style["G",14,Bold],G[t1],{0,-1.2}],Point[H[t1]],Text[Style["H",14,Bold],H[t1],{0,-1.2}]},{Orange,Thick,InfiniteLine[{E1[t1],B[t1]}]}}],AspectRatioAutomatic,AxesTrue,AxesOrigin{0,0},AxesLabel{x,y},PlotRange{{-3,3},{-3,6}},ImageSize500,Style["Geometric Locus of G and H",Bold,Large],{{t1,-3+0.00002,"Value (t)"},-3+0.000001,3,0.00001},AutorunSequencing->All,ControlPlacementTop
2
t
2
21-+2
2
t
1++
2
t
4
t
1+2+
2
t
4
t
21-+2
2
t
1++
2
t
4
t
1+2+
2
t
4
t
2
t
2
21--2
2
t
1++
2
t
4
t
1+2+
2
t
4
t
21--2
2
t
1++
2
t
4
t
1+2+
2
t
4
t
2
t
2
t3+-4
4
t
1++
2
t
4
t
2
2
(1+)
2
t
1
4
2
t
2(-1+)-1++2
2
t
2
t
1++
2
t
4
t
2
(1+)
2
t
t3++4
4
t
1++
2
t
4
t
2
2
(1+)
2
t
1
4
2
t
2(-1+)1-+2
2
t
2
t
1++
2
t
4
t
2
(1+)
2
t
2
t
2
Out[]=