The global, environmental, and public health threats posed by water scarcity will continue to escalate as climate change worsens, increasing the urgency to find potential solutions such as geoengineering, or specifically, cloud seeding. Cloud seeding involves releasing particles called Cloud Condensation Nuclei (CCNs) into the atmosphere, around which water vapor condenses until droplets become heavy enough to fall as precipitation. This study explores how surfactant-based CCNs can improve the efficiency of cloud seeding by promoting water vapor condensation. Using molecular simulations and the Lennard-Jones potential, vapor–surfactant interactions are modeled to define a threshold for droplet formation based on energy and proximity. Calculating this critical condensation radius provides a comparison point between different CCNs, offering a valuable metric that is more effective than precipitation yield in describing seeding success.
Introduction
Introduction
The Problem
The Problem
Water scarcity is one of the most pressing issues of our time. Currently, around 40% of the global population experiences limited access to water, a figure that is expected to rise sharply due to climate change. UNICEF projects that by 2031, more than 700 million people could be displaced due to lack of water availability, and by 2040, 1 in 4 children will be living in areas of extreme water stress. This scarcity has cascading effects on public health, due to how it forces populations to rely on potentially unsafe water sources, global food systems, and ecosystems.
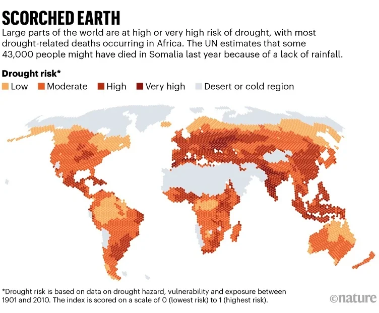
To combat this, weather modification strategies such as cloud seeding are becoming increasingly popular.
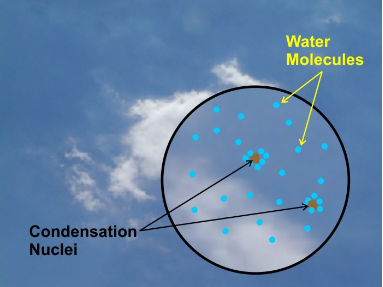
Cloud seeding is a process where particles called Cloud Condensation Nuclei (CCNs) are released in the atmosphere. CCNs are typically ionic salt compounds such as Sodium Chloride (NaCl) and Silver Iodide (AgI), though AgI is more popular for Ice Nucleation and NaCl is better for warm clouds. Although several countries are researching cloud seeding, there has been little work done in optimizing CCNs and finding metrics to measure their effectiveness.
Cloud seeding effectiveness depends on the activation of these CCNs into cloud droplets. Activation occurs when atmospheric water vapor condenses onto the particle, which requires the local supersaturation to exceed a critical threshold defined by the Köhler curve. Supersaturation is the state where relative humidity exceeds 100%, providing the thermodynamic driving force for droplet growth. Smaller or more hygroscopic particles activate at lower supersaturations, meaning that they are more likely to occur in the real world, while larger or less soluble particles need higher values. Theoretically, any particle can be a CCN if the supersaturation is high enough, but as it tends to be below 112% in the real world, CCNs must be very carefully chosen.
Not only is this optimization of CCNs a challenge, but it is difficult to measure how effective cloud seeding is because it is unclear whether seeding directly leads to precipitation or not, as there are thousands of other atmospheric quantities and variables that might in fluence not only whether it rains or not, but also the precipitation yield. Current estimates indicate that cloud seeding can increase the precipitation yield by 15%, but these are very unclear and have significant uncertainty attached to them.
Addressing these issues requires an understanding of the model describing cloud seeding: the Köhler equation
Scientific Basis
Scientific Basis
Droplet dynamics during cloud seeding are described by the Köhler equation, which presents cloud seeding through two opposing forces: evaporation, exemplified by the curvature effect, and condensation, exemplified by Raoult’s Law.
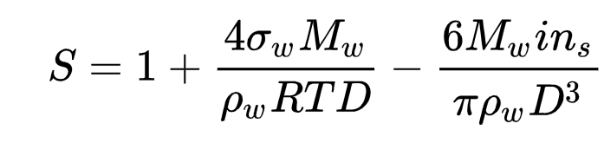
The curvature effect states that due to the smaller size of the CCN, their higher surface tension is pulling molecules on the surface inwards, creating higher internal pressure in the droplet, making the CCNs more prone to break free and evaporate. In contrast, Raoult’s Law states that as water droplets continue to condense around the CCN, the less likely the particle is to evaporate due to the introduction of a solute decreasing the vapor pressure of the solvent. A majority of the research conducted on optimizing CCNs has been trying to maximize the impact of Raoult’s Law, ignoring the hindering curvature effect.
The term that has the greatest impact on the curvature effect is the surface tension. Decreasing surface tension decreases the curvature effect and therefore the threat of evaporation, making it more likely for droplets to reach the stage of activation.
Decreasing the surface tension is done through the addition of surfactants, chemicals that lodge themselves in the interfacial layer of liquids with their hydrophilic head that attracts water and hydrophobic tails that repel it. Surfactants are very effective at decreasing surface tension until they reach a Critical Micelle Concentration (CMC). One of the most effective surfactants, due to its relatively high CMC, is Cetyltrimethylammonium Bromide (CTAB).
Computational models that evaluate how effective surfactants are as CCNs have been done before, but rather than isolating the system to surfactant–water interactions, they are typically implemented via meteorological simulations that fail to capture the nuances of different surfactants’ impacts. Such large-scale models average out the details of molecular-scale activation, ignoring how variations in surfactant solubility, molecular structure, and interfacial behavior modify critical supersaturation and activation efficiency.
A more rigorous approach requires molecular-level simulations that explicitly resolve the interactions between water molecules and surfactant coatings on CCNs. This includes evaluating how surfactants reduce surface tension, alter the Köhler curve, and shift activation thresholds. By quantifying these effects, one can better predict which formulations lower the energy barrier for droplet formation under realistic supersaturation conditions.
Goals
Goals
Because field trials for cloud seeding are expensive, weather-dependent, and ethically complex, this study uses computational experimentation to model the behavior of water vapor interacting with surfactant-based CCNs.
This research investigates: How can molecular level simulations of water-surfactant interactions through the Lennard-Jones potential be used to model and compare the effectiveness of different surfactant-based CCNs in promoting condensation?
There are two primary goals for this experiment:
1) Create a simulation that tracks the motion of vapor particles and their interaction with surfactants, using the Lennard-Jones potential to define a threshold for condensation based on proximity and energy.
2) Develop a pipeline that can evaluate and compare the effectiveness of different surfactant formulations as CCNs by calculating their Lennard-Jones parameters through quantum chemical potential energy scans and incorporating these into the condensation model to predict efficiency.
Modeling the Lennard-Jones Potential for Condensation
Modeling the Lennard-Jones Potential for Condensation
Ideally, modeling the efficiency of surfactants in attracting droplets would require solving the many-body Schrödinger equation or running complex quantum molecular dynamics simulations. However, those are theoretically impossible to solve, requiring extensive time and resources beyond the scope of this study. Therefore, it is logical to use simpler models that still capture the core physics concepts. As water aggregation around surfactants does not involve forming new chemical bonds, the classical forces and models can be applied. Among these, the Lennard-Jones (LJ) potential is the least computationally expensive option while still effectively approximating short-range repulsive and longer-range attractive forces between molecules. The LJ potential models CTAB-water interactions as a function of intermolecular distance. The LJ potential can be written as:In this equation:- r is the distance between the two particles- ϵ is the Lennard-Jones depth, or, the strength of the interaction- σ is the size-proxy, when the potential energy crosses zeroA way to interpret this equation is the difference between a steep repulsive force at short differences due to electron cloud overlap and a weaker attractive force at intermediate ranges. Crucially, for complex molecules, such as surfactants, their Lennard-Jones depth and size-proxies are experimentally unknown and not recorded in literature.
V(r) = 4ϵ-
12
σ
r
6
σ
r
Known Surfactant Molecule Evaluation: CTAB
Known Surfactant Molecule Evaluation: CTAB
Cetyltrimethylammonium Bromide (CTAB) is a commonly-used cationic surfactant. In this work, the Bromide will not be included in the representation of CTAB as it is a disconnected atom. Though it is popular, there are no recorded values for its LJ depth and size proxy, and thus, assumptions regarding its structure will be made. Hence, this exploration begins by visualizing its molecular plot.
The CTAB cation is created using its SMILES string and then plotted using the MoleculePlot3D.
In[]:=
ctabCation=Molecule["CCCCCCCCCCCCCCCC[N+](C)(C)C"];MoleculePlot3D[ctabCation,PlotTheme->"BallAndStick"]
Out[]=

As seen in this image, CTAB consists of a long hydrocarbon chain with a positively charged nitrogen head-group. Due to the partial negative charge on the oxygen atoms, water is highly polar and primarily interacts with the positively charged nitrogen rather than the bromide. The simplicity of the nitrogen in comparison in CTAB means that the Lennard-Jones depth and size-proxy for it is available. The ubiquitousness of water means that its depth and size proxy are also recorded (Water Models, n.dn).
Here, the Lennard-Jones depths and size proxies of each individual components of CTAB, a cationic surfactant, are recorded, as well as for Water. As the positive head of the surfactant, the ion is the group that bonds with the anionic poles of the water molecule. Thus, when looking at the epsilon and sigma values for CTAB-water interactions, will be approximated to represent the sigma and epsilon of CTAB.
Here, the Lennard-Jones depths and size proxies of each individual components of CTAB, a cationic surfactant, are recorded, as well as for Water. As the positive head of the surfactant, the
N
4
N
4
The Lennard-Jones depth and size-proxies (epsilon and sigma, respectively) are defined as variables with already known values.
In[]:=
sigmaN4=0.415;epsilonN4=0.618;sigmaOW=0.3166;epsilonOW=0.6502;
These known values show the interaction of molecules with themselves, so water molecules interacting with other water molecules, rather than a water molecule interacting with Nitrogen. To remedy this, the Combination Rules can be applied.
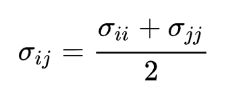
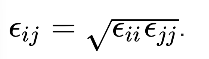
The CTAB-water size-proxy and LJ depth are computed using the combination rules.
In[]:=
sigmaCombined=(sigmaN4+sigmaOW)/2;epsilonCombined=Sqrt[epsilonN4*epsilonOW];
Now, the Lennard-Jones potential can be graphed:
Now, the Lennard-Jones potential can be graphed:
The general movement of the droplet is defined by lennardJones, and in the case of interactions with surfactants, it models the Lennard-Jones Potential:
In[]:=
lennardJones[r_]:=4*epsilonCombined*(((sigmaCombined/r)^12)-((sigmaCombined/r)^6))
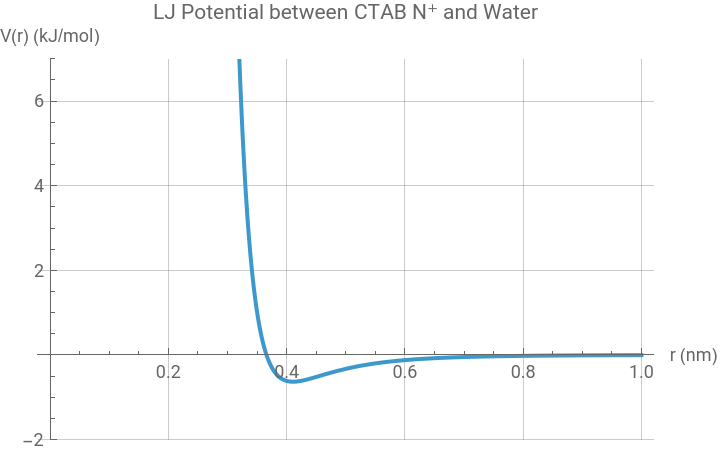
The minimum value of the function lennardJones is calculated and recorded, as well as the distance that evaluates to this minimum.
In[]:=
NMinimize[{lennardJones[r],0.2<=r<=1.0},r]
Out[]=
{-0.633896,{r0.410597}}
The function Plot is used to display the Lennard-Jones potential as the distance between the molecules changes.
In[]:=
PlotlennardJones[r],{r,0.1,1.0},PlotRange->{-2,7},PlotLabel->"LJ Potential between CTAB N⁺ and Water",AxesLabel->{"r (nm)","V(r) (kJ/mol)"},PlotRange->All,GridLines->Automatic,PlotStyle->Thick
Out[]=
The negative derivative is calculated:
Now, because the force is radial, it must me split into x and y components.
By splitting the magnitude of the force along the Cartesian directions, the x and y components of the radial force are defined.
The initial positions are defined in terms of x and y, and the initial velocity is defined in terms of x and y components. Note that the position of the surfactant molecule is (0, 0).
The NDSolve function numerically solves the system of second-order ODEs for x and y over time.
The different parametric plots, of x vs t and x vs t, are graphed to see how the individual position components move over time using the ParametricPlot function. The range of t is set between 0 and 40 seconds because that is sufficient to see the interaction between the water molecule and CTAB.
It becomes immediately clear that the droplet does not follow the direction that was initially assigned to it. The rate of change of the x and y positions change between a time period of 0 to around 10ps, and therefore it can be inferred that the velocity changes. The lack of constant velocity means that the water vapor is experiencing a net force due to the Lennard-Jones potential.
To visualize the trajectory of the droplet, the y vs. x graph can be plotted with ParametricPlot, too.
It becomes very important to notice that the trajectory of the water vapor does not pass through the point (0,0), the exact position of the surfactant molecule. This is due to the nature of hydrogen bonding, which has a finite effective range. There must be energy required to change the phase of the water vapor from gas to liquid to condense with the surfactant molecule. If too far, these bonds can not form, and if too close, repulsive forces dominate.
To combat this, a threshold function must be implemented on the following assumption: if the radial distance between the water vapor and surfactant falls below the distance at which the LJ potential reaches its minimum, the interaction will lead to the water vapor to condense onto the surfactant molecule. The threshold function is logical both from a physical and chemical perspective, given that the Van der Waals forces means that no electrons are exchanged between or shared by the two molecules. It is also sensible that particles with high enough energy can pass through the real barrier of potential that is necessary for them to attach themselves to another molecule.
To identify the threshold, it is not enough to use x and y coordinates as the primary distance metric. Rather, they must be transformed into a radial function.
Since the LJ potential is dependent only on the distance from the water molecule, it is convenient to use radial coordinates:
The function rOfT computes the radial distance r(t) from the previously determined x(t) and y(t) solutions.
The critical, or minimum, radius is defined as a variable and is set equal to the equation shown above.
The function condensedQ checks whether the current radius is lower than the critical radius, and the function condensateFcn determines how far away the current radius is from the critical radius.
The trajectory of the droplet is once again graphed, but this time, a line with the equation y = critical radius is also added as a visual representation of whether the minimum threshold for condensation is crossed.
As seen in this graph and output, the minimum threshold for condensation is 0.360nm. To evaluate whether this is a realistic estimate, the ‘bond’ length of the Nitrogen cation and partial-negative Oxygen must be compared to it. As the two molecules will be held together via an IMF rather than a covalent bond, the minimum threshold must be within twice the sum of the combined Van der Waals of Nitrogen and Oxygen.
The Van der Waals radius of nitrogen and oxygen are fetched from the ElementData dataset and then added together.
As 0.466 is within 2x the value of the combined radii, 0.307nm, it is safe to assume that Intermolecular Forces can hold the surfactant molecule to the water vapor molecule, thus making this threshold function realistic.
Thus, by using rudimentary estimates of the Lennard-Jones depth and size-proxy of a known surfactant, CTAB, it was possible to model its interaction with a water-vapor via the Lennard-Jones potential. It was found that the critical radius that could lead to condensation was 0.307nm. Though this is useful information, very little is told to us about how relevant it is in the context of cloud seeding without comparing it to a non-seeded environment where there are only water molecules. Though it is true that Aerosol Particles (AP) are necessary to produce clouds, they have miniscule impacts on the condensation of water vapor and its process to become heavy enough to precipitate.
To compare how effective seeded CTAB is to a non-seeded environment, the minimum threshold for condensation can be calculated assuming there are only water-water interactions by calculating the critical radius where the size-proxy is that of solely water.
The water-CTAB critical radius is around 150% that of the water-water critical radius. The difference means that water molecules can experience condensation with a surfactant molecule at larger distances than they can with another water molecule, thus meaning that they experience stronger attractive forces.
Potential Energy Scan for Lennard-Jones Parameters
Potential Energy Scan for Lennard-Jones Parameters
What is very important to note about the previous example was that the epsilon and sigma values that were used for CTAB were estimates, based off Nitrogen-Nitrogen interactions. Nitrogen was the positively charged ion in CTAB, and due to the lack of data availability, it was considered in isolation with water. As electrons from different atoms will influence this interaction, to have a better estimate, the Schrodinger’s Equation must be modeled through the Wolfram Quantum Chemistry Paclets.
The Paclet must be installed to the system via PacletInstall.
A molecule of CTAB, referred to as mol, is created, and its electrical energy is accessed via GroundStateEnergy. The molecule geometry is a guess and not usually the true lowest-energy shape.
It is impossible to analytically solve Schrodinger’s equations with multiple electrons due to it being impossible to compute electron-electron interactions and to describe all the electrons in a molecule at once. Thus, ModelChemistry must be utilized and loaded.
ModelChemistry is loaded.
It is impossible to run the calculations with a detached Bromide anion, thus it must be removed. The bromide anion is removed by using MoleculeModify to delete the atom after finding its index.
Indication that it has been removed is seen in how the number of atoms decreases from 63 to 62, but to verify whether Bromide has been deleted, the net charge must be checked. The net charge should be 1+ as a negative charge has been deleted.
When a molecule is created, a “guess” geometry is returned-- and this geometry is often not the most optimal structure. The optimal structure is naturally preferred by the molecule as it is the true equilibrium structure and the energy minimum on the potential energy surface. As the PotentialEnergyScan holds all other coordinates fixed , beginning at an unrelaxed geometry means that bond lengths and angles will be wrong. Thus, before completing this step, the geometry of not only CTAB but CTAB’s interaction with water must be optimized.
OptimizeMoleculeGeometry is loaded.
The initial conditions, the bond lengths, are returned.
The model to optimize the geometry is defined and run as HartreeFock at sto-3g. Though this model is very efficient, it is not as precise as more computationally-expensive as other models.
Since the interactions between CTAB and water vapor are being studied, a water molecule must be created. This will not be a single or double bond because condensation does not involve the exchanging or sharing of electrons, but rather the ion-dipole intermolecular force, making it a Zeroth Order bond.
The additional molecule and additional bond is created using the MoleculeModify function by first creating a molecule object and adding a bond between atom 17, the nitrogen, and an oxygen.
Plotting the molecule shows the creation of the zero order bond:
With the creation of this new molecule and molecule bond, the geometry must once again be optimized. When a molecule is created, a “guess” geometry is returned-- and this geometry is often not the most optimal structure. The optimal structure is naturally preferred by the molecule as it is the true equilibrium structure and the energy minimum on the potential energy surface. As the PotentialEnergyScan holds all other coordinates fixed , beginning at an unrelaxed geometry means that bond lengths and angles will be wrong. Thus, before completing this step, the geometry of not only CTAB but CTAB’s interaction with water must be optimized.
With the now-optimized CTAB-water interaction, the Potential Energy must be computed, for which the PotentialEnergyScan function is utilized. It maps how the electronic energy of the system changes as the Zero Order born between the nitrogen and oxygen is varied, giving access to the intermolecular interaction energy as a function of separation energy.
Plotting the molecule shows the optimal structure:
The potential energy (eV) as a function of distance (nm) is plotted and saved as the quantity array data. The domains of the bond lengths tested are 0.2nm to 10nm. This range was specifically chosen as it extends below the Van der Waals radius of both the nitrogen and oxygen particles and extends significantly past that when it is has reached its asymptote.
The Lennard-Jones potential equation is defined with parameters eps representing the Lennard-Jones depth and sigma representing the size proxy.
The potential energy data is stripped of units to ensure it can be directly fit to the Lennard-Jones equation.
The magnitudes of the potential energy, derived from data, are plotted for bond lengths the same domain that the scan was run.
The NonlinearModelFit function fits the Potential Energy data to the Lennard-Jones potential, thereby calculating values for the Lennard-Jones depth and the size-proxy for CTAB-water interactions.
As seen in a previous section, the minimum distance for condensation is calculated by taking the derivative of the Lennard-Jones equation, or rather multiplying the size-proxy by the sixth-root of 2. These calculations show a distance of 0.529 nm. As already discussed, the combined Van der Waals radius of Nitrogen and Oxygen is approximately 0.307nm. As the distance of 0.529 is within 1 - 2x that value, it is logical that a Van der Waals force can form between the surfactant and the water molecule, leading to condensation.
Generally, the higher the distance of condensation, the better, as this means that the attractive forces are strong enough to lead to condensation at even a further distance away. This principle becomes crucial in the determination of the efficiency of unknown surfactants are.
Modeling Unknown Surfactants
Modeling Unknown Surfactants
Preparing Molecule
Preparing Molecule
The surfactant molecule is defined with its official name and then plotted with MoleculePlot3D
The MoleculeComplex Paclet is installed and loaded
To work with this paclet, the molecule has to be converted to a data type that is understandable by this paclet. MakeMolecule3D ensures that clear coordinates are assigned to each atom.
A water molecule is loaded and also made 3D.
The MoleculeComplex function is used to combine the surfactant and water into one molecule, though, as seen in the 3D plot, there is no bond between them.
To add a bond, the function MoleculeModify will be used, but this is only possible when waterMoleculeComp is saved as a molecule type again.
As shown in the 3D plot, the surfactant molecule contains a total of eight oxygen atoms. To determine the optimized geometry, a hydrogen atom must be individually bonded to each of these oxygen sites, and the corresponding complex energy for each configuration will be recorded. The configuration with the lowest complex energy represents the most favorable bonding site. Once the optimal geometry is identified, a potential energy scan can be performed and the results fit to the Lennard-Jones equation, as was previously done for CTAB.
Optimization Demonstration
Optimization Demonstration
The MoleculeModify function is used to create a Zero Order bond between the Oxygen at index 34 and the Hydrogen in the water molecule. The hydrogen bond was treated as a zero order.
To ensure that the bonds will be a uniform distance apart, the bond length is defined using the MoleculeModify function, and the resulting molecule is plotted.
The water molecule and the surfactant are combined into a single MoleculeComplex object, which is then passed to the OptimizeGeometry function. This function retains the hydrogen bond between them while adjusting the molecules’ relative orientation and distance to achieve the most energetically favorable configuration.
The ComplexEnergy function calculates the binding energy of the molecular complex. The lower the complex energy, the better the configuration. Since the isolated molecules do not change, the complex energy is sufficient to determine which configuration will be the most optimized.
A similar procedure is repeated for all 7 other oxygen atoms in this molecule, and then the minimum complex energy is determined. The configuration with the lowest complex energy is the most optimized and is analyzed further.
Optimization of Molecule
Optimization of Molecule
-118.785 kcal/mol is the lowest complex energy, making this configuration the most optimal. The critical radius of condensation will be computed using this geometry.
Solving for Critical Radius
Solving for Critical Radius
To run the Potential Energy scan, the waterMoleculeComp must be converted to a Molecule object.
The potential energy is plotted, and the domains of bond lengths tested are 0.2nm to 8nm. The domains of the bond lengths tested are 0.2nm to 10nm. This range was specifically chosen as it extends below the Van der Waals radius of both the hydrogen and oxygen particles and extends significantly past that when it is has reached the minimum value.
The raw values of the data is saved to plainSurf, and the LJ equation is redefined.
A NonlinearModelFit is implemented to fit the potential energy equation to the Lennard Jones potential. This fit willh elp determine the Lennard-Jones depth and the size-proxy.
The parameters are saved as epsFit and sigmaFit.
Now that the size-proxy value has been determined, the critical radius equation can be repurposed to calculate the minimum threshold for condensation between this untested surfactant molecule and a water molecule.
The critical radius of this surfactant is lower than that of water, indicating weaker attractive forces between it and water molecules. This result is very interesting as this study believed that surfactants would only encourage condensation rather than hinder it, a result that was echoed in the results of CTAB.
The disparity in results between this molecule and CTAB may be that this is a neutral molecule while CTAB was positively charged, leading to higher electrostatic forces. Molecular geometry may also play a role -- there is a clear hydrophobic region in the long hydrocarbon chain, and the hydrophilic region appears with the several oxygen atoms, but there is no strongly ionic or charged group such as a sulfate.
The disparity in results between this molecule and CTAB may be that this is a neutral molecule while CTAB was positively charged, leading to higher electrostatic forces. Molecular geometry may also play a role -- there is a clear hydrophobic region in the long hydrocarbon chain, and the hydrophilic region appears with the several oxygen atoms, but there is no strongly ionic or charged group such as a sulfate.
Conclusion
Conclusion
This project successfully simulated and analyzed molecular interactions in the context of cloud seeding, using the Lennard-Jones potential to model surfactant behavior at the nanoscale. By shifting the focus from precipitation yield to condensation radius, this study quantified cloud seeding effectiveness. CTAB increased the condensation radius by 150%, confirming that it is a highly promising candidate for enhanced cloud condensation nuclei.
However, this impact was not universal. Surfactants containing dihydropyran rings exhibited the opposite effect, decreasing condensation capability. The structural features responsible, such as the absence of a charged hydrophilic head and a bulky, ringed conformation, are characteristic of many naturally occurring surfactants. This reinforces and confirms that though surfactants like CTAB are highly effective, there must be a discovery of bio-based alternatives that can match their performance.
Though based on a simplified two-body potential and not accounting for long-range interactions, this computational framework offered clear insight into complex surfactant-aerosol behavior.
Future Directions
Future Directions
The most clear path forward for this work is to streamline the modeling process into a single, unified function that can accept surfactant molecules as input and automatically run the quantum chemical potential energy scans, extract Lennard-Jones parameters, and simulate condensation behaviour. This function would then be able to provide a pipeline that is robust and, without manual intervention, evaluate several compounds and increase feasibility of large-scale screenings. Such a function is currently being worked on and is planned to be submitted to the Wolfram Functions Repository. Additionally, there are plans to expand the molecule to incorporate several relevant chemical and physical properties of surfactants, such as molar mass, CMC point, solubility, hygroscopicity, and then quantifying how these parameters impact condensation thresholds. This framework would be able to optimize multiple parameters and lead to identifications of surfactants with the most effective CCN properties.
Though shifting to naturally occurring surfactants that are biodegradable may be a step forward from using surfactants like CTAB, there are still severe environmental repercussions that are still not yet fully understood. Modeling the deposition, dissolution, and potentially toxic pathways of these surfactants upon release as CCN would help understand the true impact cloud seeding has on the environment.
The results of this study also promote further investigation as the notion that every surfactant promotes droplet growth has been challenged. This example indicates that charged and non-branched surfactants are necessary for seeding solutions, and though this trait is rare for naturally found surfactants, identifying one of them would be an interesting test of effectiveness.
Acknowledgements
Acknowledgements
I would like to thank my mentor, Daniele Ceravolo, and Dr. Jason Sonnenberg, for supporting me through my research . I would also like to thank Dr. Jason Biggs for the creation of the Quantum Chemistry paclet and Dr. Robert Nachbar for the creation of the MoleculeComplex paclet. Many thanks to William Choi-Kim, and thank you to the WSRP program for allowing me to pursue my interests.
References
References
ARHCIVED - NASA Climate Change. (2024, January 29). How Lab Experiments Help Disentangle Aerosol-Cloud Interactions Relevant to Cloud Optical Properties. YouTube. https://www.youtube.com/watch?v=Vw4BCFUHFWU
Brune, W. (n.d.). 5.4 Curvature Effect: Kelvin Effect | METEO 300: Fundamentals of Atmospheric Science. In www.e-education.psu.edu. https://www.e-education.psu.edu/meteo300/node/676
Co, J. R. H. (2023, November 15). Critical Micelle Concentration: Measuring Surfactant Efficiency - J R Hess & Co., Inc. Https://Www.jrhessco.com/. https://www.jrhessco.com/critical-micelle-concentration-measuring-surfactant-efficiency/
Columbus Chemical Industries. (2021). Cetyltrimethylammonium Bromide (CTAB) 1. PRODUCT AND COMPANY IDENTIFICATION Product Name: Cetyltrimethylammonium Bromide (CTAB) Synonyms/Generic Names: Cetrimonium bromide; N,N,N-trimethyl-1-hexadecanaminium bromide; Hexadecyltrimethylammonium bromide; Palmityltrimethylammonium bromide; CTAB. https://www.columbuschemical.com/MSDS/SDS/Cetyltrimethylammonium%20Bromide%20(CTAB)%201320.pdf
DeFelice, T. P., Golden, J., Griffith, D., Woodley, W., Rosenfeld, D., Breed, D., Solak, M., & Boe, B. (2014). Extra area effects of cloud seeding — An updated assessment. Atmospheric Research, 135-136, 193–203. https://doi.org/10.1016/j.atmosres.2013.08.014
Dennis, A. (1980). Chapter V Generation and Application of Silver Iodide Crystals and Other Seeding Agents. International Geophysics/International Geophysics Series, 24, 96–134. https://doi.org/10.1016/s0074-6142(08)60124-2
Drought.gov. (2025, June 17). National Current Conditions. Drought.gov. https://www.drought.gov/current-conditions
Fajardo, C., Costa, G., Ortiz, L. T., Nande, M., Rodríguez-Membibre, M. L., Martín, M., & Sánchez-Fortún, S. (2016). Potential risk of acute toxicity induced by AgI cloud seeding on soil and freshwater biota. Ecotoxicology and Environmental Safety, 133, 433–441. https://doi.org/10.1016/j.ecoenv.2016.06.028
Forestieri, S. D., Staudt, S. M., Kuborn, T. M., Faber, K., Ruehl, C. R., Bertram, T. H., & Cappa, C. D. (2018). Establishing the impact of model surfactants on cloud condensation nuclei activity of sea spray aerosol mimics. Atmospheric Chemistry and Physics, 18(15), 10985–11005. https://doi.org/10.5194/acp-18-10985-2018
Hudson, J. G. (2002). Cloud condensation nuclei spectra and polluted and clean clouds over the Indian Ocean. Journal of Geophysical Research, 107(D19). https://doi.org/10.1029/2001jd000829
LibreTexts. (2013, October 2). Raoult’s Law. Chemistry LibreTexts. https://chem.libretexts.org/Bookshelves/Physical_and_Theoretical_Chemistry_Textbook_Maps/Supplemental_Modules_(Physical_and_Theoretical_Chemistry)/Physical_Properties_of_Matter/Solutions_and_Mixtures/Ideal_Solutions/Changes_In_Vapor_Pressure_Raoult%27s_Law
Lower, S. (n.d.). Liquids and their interfaces [Diagram]. https://chem.libretexts.org/Bookshelves/General_Chemistry/Chem1_(Lower)/07%3A_Solids_and_Liquids/7.04%3A_Liquids_and_their_Interfaces
McDonough, F. (n.d.). What is Cloud Seeding? Desert Research Institute. https://www.dri.edu/cloud-seeding-program/what-is-cloud-seeding/
McGraw, R., & Wang, J. (2021). Surfactants and cloud droplet activation: A systematic extension of Köhler theory based on analysis of droplet stability. The Journal of Chemical Physics, 154(2). https://doi.org/10.1063/5.0031436
Munch, D. (2024, February 29). Major Disasters and Severe Weather Caused Over $21 Billion in Crop Losses in 2023. American Farm Bureau Federation. https://www.fb.org/market-intel/major-disasters-and-severe-weather-caused-over-21-billion-in-crop-losses-in-2023
Nakama, Y. (2017). Surfactant - an overview | ScienceDirect Topics. Sciencedirect.com. https://www.sciencedirect.com/topics/chemistry/surfactant
National Oceanic and Atmospheric Administration. (2022). NOAA CDR PATMOSX: Cloud Properties, Reflectance, and Brightness Temperatures, Version 5.3 | Earth Engine Data Catalog | Google for Developers. Google for Developers. https://developers.google.com/earth-engine/datasets/catalog/NOAA_CDR_PATMOSX_V53
National Oceanic and Atmospheric Administration. (2023, March 28). How Clouds Form. Www.noaa.gov. https://www.noaa.gov/jetstream/clouds/how-clouds-form
Nelli, N., Francis, D., Abida, R., Fonseca, R., Masson, O., & Bosc, E. (2024). In-situ measurements of fog microphysics: Visibility parameterization and estimation of fog droplet sedimentation velocity. Atmospheric Research, 309, 107570. https://doi.org/10.1016/j.atmosres.2024.107570
Okaka, F. O., & Odhiambo, B. D. O. (2018). Relationship between Flooding and Out Break of Infectious Diseasesin Kenya: A Review of the Literature. Journal of Environmental and Public Health, 2018(1), 1–8. https://doi.org/10.1155/2018/5452938
Ovadnevaite, J., Zuend, A., Laaksonen, A., Sanchez, K. J., Roberts, G., Ceburnis, D., Decesari, S., Rinaldi, M., Hodas, N., Facchini, M. C., Seinfeld, J. H., & O’ Dowd, C. (2017). Surface tension prevails over solute effect in organic-influenced cloud droplet activation. Nature, 546(7660), 637–641. https://doi.org/10.1038/nature22806
Petters, M. D., & Kreidenweis, S. M. (2007). A single parameter representation of hygroscopic growth and cloud condensation nucleus activity. Atmospheric Chemistry and Physics, 7(8), 1961–1971. https://doi.org/10.5194/acp-7-1961-2007
Pierce, J. R., & Adams, P. J. (2007). Efficiency of cloud condensation nuclei formation from ultrafine particles. Atmospheric Chemistry and Physics, 7(5), 1367–1379. https://doi.org/10.5194/acp-7-1367-2007
Pruppacher, H. R., & Klett, J. D. (2011). Microphysics of clouds and precipitation. Springer, Impr.
Shafiei, S., Akbari, M., Botha, N., & Maaza, M. (2023). A study on the size effect of AgI on cloud seeding. Materials Today: Proceedings. https://doi.org/10.1016/j.matpr.2023.07.374
Thaveau, B., Serpolay, R., & Piekarski, S. (2003). Influence of surfactants on droplet growth by water vapor condensation on NaCl particles: experimental investigations and theoretical implications. Atmospheric Research, 21(1), 83–96. https://doi.org/10.1016/0169-8095(87)90019-6
UNICEF. (2020). Water Scarcity. UNICEF. https://www.unicef.org/wash/water-scarcity
United Nations Development Programme. (2023). Regulating the unknown. UNDP. https://www.undp.org/future-development/signals-spotlight-2023/regulating-unknown
Wastewater Digest. (2018, March 15). World Bank and U.N. Claim 40% of World Population Affected by Water Scarcity. Wastewater Digest. https://www.wwdmag.com/utility-management/news/10936599/world-bank-and-un-claim-40-of-world-population-affected-by-water-scarcity
Water models. (n.d.). Water.lsbu.ac.uk. https://water.lsbu.ac.uk/water/water_models.html
World Health Organization: WHO. (2019, July). Cholera. Who.int; World Health Organization: WHO. https://www.who.int/health-topics/cholera
CITE THIS NOTEBOOK
CITE THIS NOTEBOOK
Simulating surfactant-water interactions for applications in cloud seeding
by Yuti Purohit
Wolfram Community, STAFF PICKS, July 11, 2025
https://community.wolfram.com/groups/-/m/t/3503212
by Yuti Purohit
Wolfram Community, STAFF PICKS, July 11, 2025
https://community.wolfram.com/groups/-/m/t/3503212